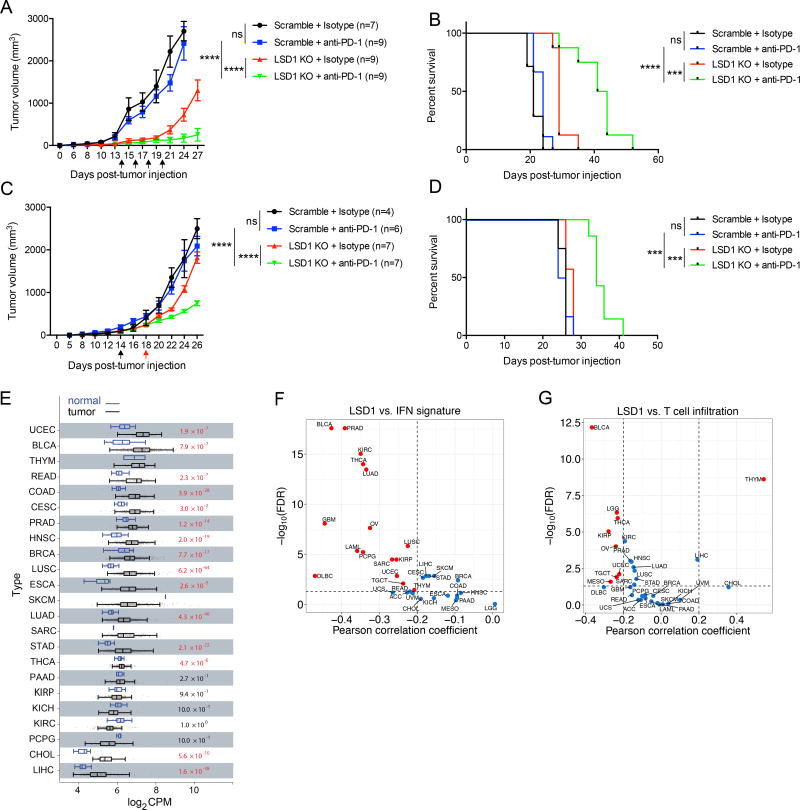
Figure 7. LSD1 inhibition overcomes tumor resistance to PD-1 blockade in a mouse model and LSD1 expression level is inversely correlated with T cell infiltration in human tumors.
(A and B) Tumor growth (A) and survival curves (B) of immunocompetent mice inoculated with 250k B16 cells, and treated with anti-PD-1 or isotype control. Arrows indicate time points of anti-PD-1 injection.
(C and D) Tumor growth (C) and survival curves (D) of immunocompetent mice inoculated with 500k B16 cells, and treated with anti-PD-1 or isotype control based on a set tumor size (~200 mm3) for initial treatment. Arrows indicate time points of initial anti-PD-1 injection into scramble tumor-bearing mice (in black) and LSD1 KO tumor-bearing mice (in red), followed by additional anti-PD-1 injections every other day.
(E) The analysis of LSD1 RNA expression in tumors and normal tissues from patients with indicated types of cancers in TCGA dataset.
(F and G) Correlation analysis for LSD1 expression level versus IFN signature (F) or CD8+ T cell infiltration (G) in tumors from indicated types of cancer patients in TCGA dataset.
Error bars represent SEM of individual mice per group in one experiment. ***p < 0.001, ****p < 0.0001, ns, not significant, as determined by 2-way ANOVA (A and C), or Log-rank test (B and D).
Also see Figure S7.

