
Figure 2.
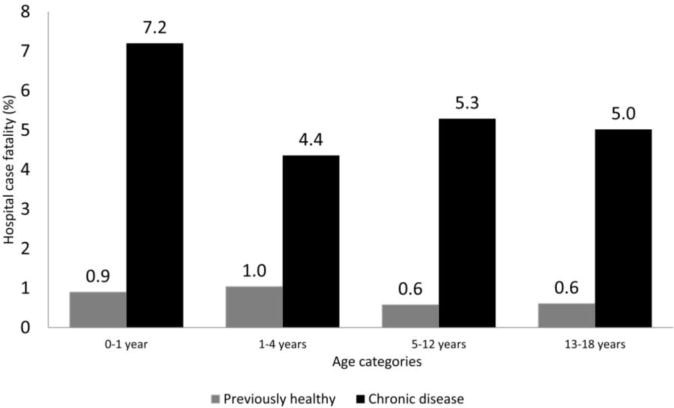
Hospital mortality by age group and chronic disease. Previously healthy patients in each age group are shown as gray bar and patients with chronic disease are shown as black bar.
Official websites use .gov
A
.gov website belongs to an official
government organization in the United States.
Secure .gov websites use HTTPS
A lock (
) or https:// means you've safely
connected to the .gov website. Share sensitive
information only on official, secure websites.
Hospital mortality by age group and chronic disease. Previously healthy patients in each age group are shown as gray bar and patients with chronic disease are shown as black bar.