
Figure 1. Endogenous expression of CA8, TrkA, ITPR1 and pITPR1 in cell lines.
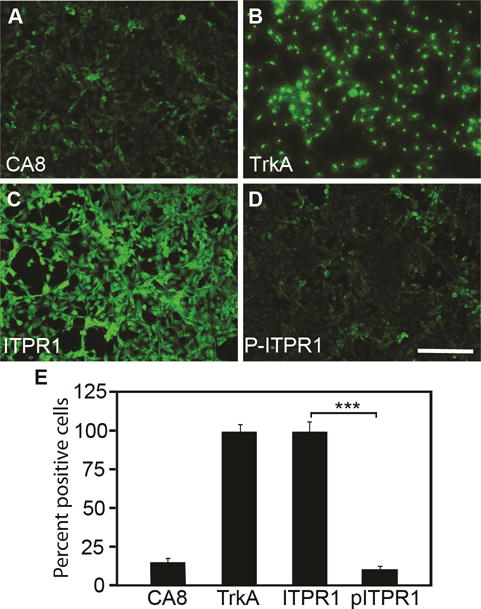
Baseline expression of CA8, TrkA, ITPR1, and pITPR1 are shown for NBL cells using immunohistochemistry (A-D). Quantitation (E) was relative to DAPI staining, which was used to normalize positive staining cells. We observed low levels of CA8 and pITPR1 relative to IPTR1. N=4 from 2 independent cultures in duplicate. Scale bar: 100 μM. (Error bars are SEM; ***P<0.001; Student’s t-test).