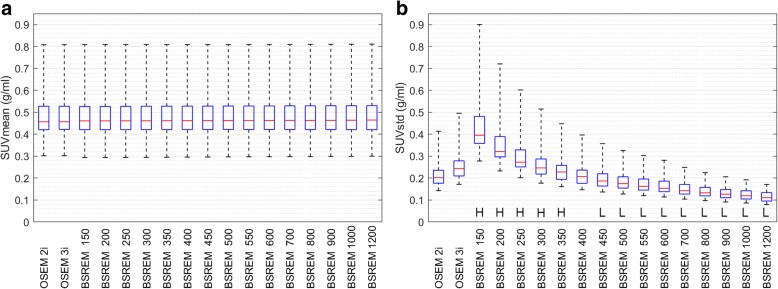
Fig. 3.
Box and whisker plots showing SUVmean and SUVstd distributions from background ROIs in 25 patients. The left panel shows SUVmean (a) and the right panel shows SUVstd (b). Each panel shows from left to right the results of the TOF OSEM reconstructions with 28 subsets and 2 and 3 iterations, followed by TOF BSREM reconstructions with regularization parameter β = 150, 200, 250, 300, 350, 400, 450, 500, 550, 600, 700, 800, 900, 1000, and 1200. H indicates significantly higher values, and L indicates significantly lower parameter values for TOF BSREM compared to reference TOF OSEM. TOF time-of-flight, SUV standardized uptake value, SUVmean the average value of the voxels in the background ROI, SUVstd the standard deviation of the values of the voxels in the background ROI, OSEM ordered subset expectation maximization, BSREM block sequential regularized expectation maximization

