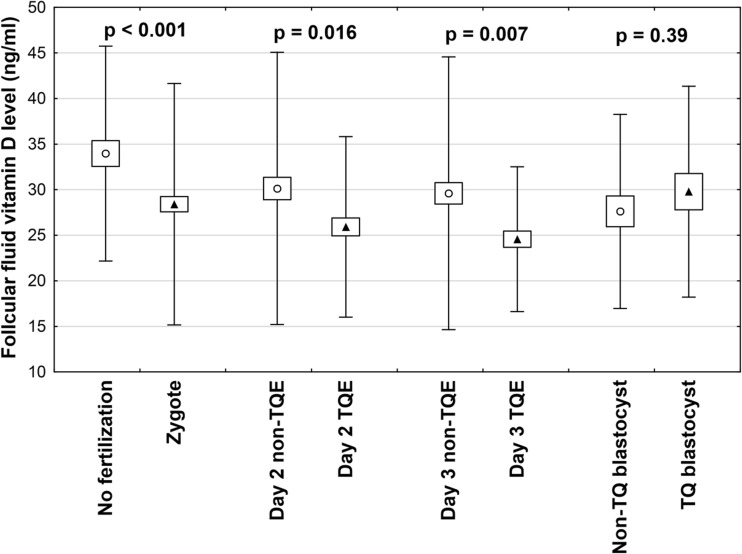
Fig. 2.
Vitamin D concentrations in FF in relation to the outcome of corresponding oocytes: fertilization and subsequent early embryo development. Each bar represents mean ± SD. FF follicular fluid, TQE top quality embryo, non-TQE non-top quality embryo. Embryo grading details are provided in the “Materials and methods” section

