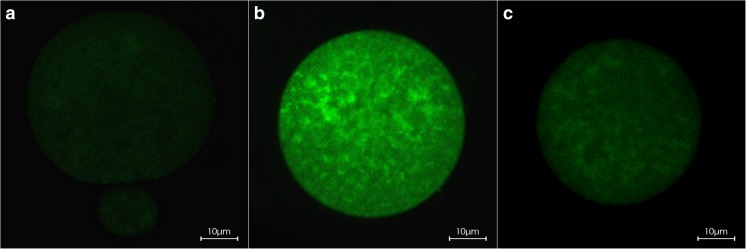
Fig. 3.
ROS staining patterns of the three groups are shown. a Fresh group showing the lowest fluorescence intensity, evenly distributed (n = 31, 25.17 ± 5.88). b Control vitrification group showing markedly enhanced fluorescence intensity with many high-intensity streaks (n = 30, 70.72 ± 28.04). c GSH-OEt group showing low fluorescence intensity with some intense streaks (n = 32, 35.52 ± 8.24). There were significant differences between the three groups (p < 0.05)

