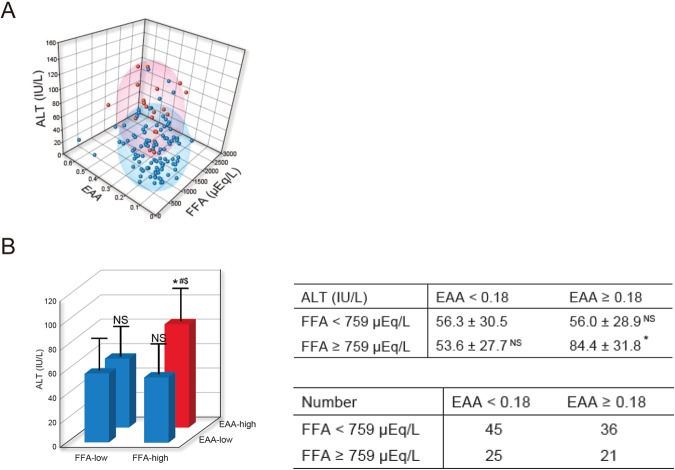
Figure 5.
Serum ALT levels of “FFA-high and EAA-high” patients showed high serum ALT. Correlations between serum FFA levels, whole blood EAA and serum ALT levels were analyzed in 127 patients with NAFLD (fibrosis stages 0, 1 and 2). (A) Serum FFA, whole blood EAA and serum ALT were plotted in three dimensions. “FFA-high and EAA-high” group is red. “FFA-low and EAA-low”, “FFA-low and EAA-high” and “FFA-high and EAA-low” groups are blue. Ellipsoid means cumulative probability = 0.75. (B) Serum ALT levels of “FFA-low and EAA-low (n = 45)”, “FFA-low and EAA-high (n = 36)”, “FFA-high and EAA-low (n = 25)” and “FFA-high and EAA-high (n = 21)” groups were analyzed. Results are presented as means ± SD. *P < 0.05 compared with “FFA-low, EAA-low”. #P < 0.05 compared with “FFA-low, EAA-high”. $P < 0.05 compared with “FFA-high, EAA-low”. NS, not significant compared with “FFA-low, EAA-low”.

