
Figure 5.
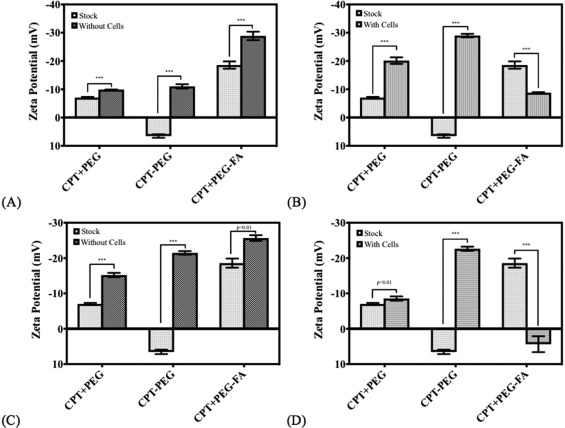
Changes in ZP on the surface of the nanocrystalline pellet measured post flow for (A) LCs with a base fibronection coating, (B) LCs seeded with endothelial cells, (C) MNs with a base fibronectin coating, and (D) MNs seeded with endothelial cells. Paired t‐test, n = 3 for all conditions. ***p < .01