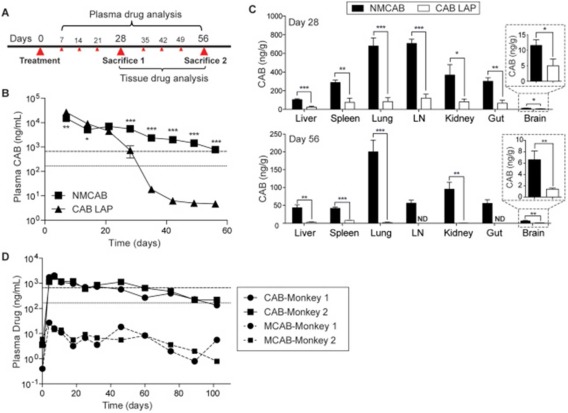
Figure 5.

(a) Experimental timeline. (b) Plasma drug concentrations analyzed by UPLC/MS/MS. (c) Tissue drug concentrations analyzed by UPLC/MS/MS. (d) Plasma drug concentrations in the non‐human primate animal models. Used with permission from Ref. 105.
