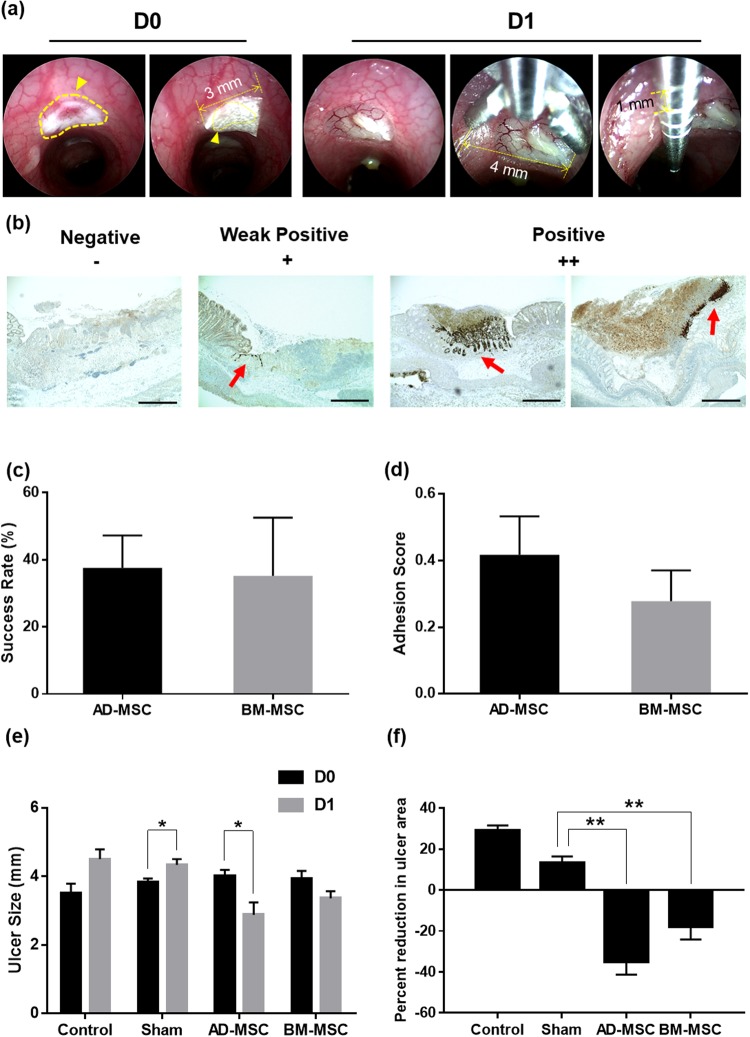
Figure 3.
Analysis of the ulcer size change following MSC sheet endoscopic transplantation in electrocoagulation model. (a) Cell sheets were transplanted onto the ulcer sites by CELLSHIFTER. The yellow line points to the ulcer site. The yellow arrow indicates the covered MSC sheets by CELLSHIFTER (left panel D0). Evaluation of colonic ulcer size. The maximum opening width of the endoscopic forceps used in the transplantation and the basic length of the forceps wire node (right panel D1). (b) Representative histological analysis based on the transplantation success. The red arrow indicates the positive signal of EGFP by immunohistochemistry. (c,d) Success rate and adhesion score of the electrocoagulation ulcer model. (e) The changes in ulcer size before and after transplantation (±SEM n = 8, each). *P < 0.05. (f) A comparison of the ulcer size changes after transplantation day (D0) between 1 day after transplant (D1) (±SEM n = 8, each) **P < 0.01. Con; only electrocoagulation, Sham; transplanted without MSC sheets, AD-MSC; AD-MSC sheets transplanted, BM-MSC; BM-MSC sheets transplanted. CELLSHIFTER size: 3 × 6 mm, Forceps width: 4 mm, Forceps wire node length: 1 mm. EGFP positive signal percentage index: negative - 0, week positive - 50, positive – 100. Adhesion score index: negative - 0, week positive - 0.5, positive – 1. MSC sheets transplanted animal, n = 9 (transplanted site, n = 18).

