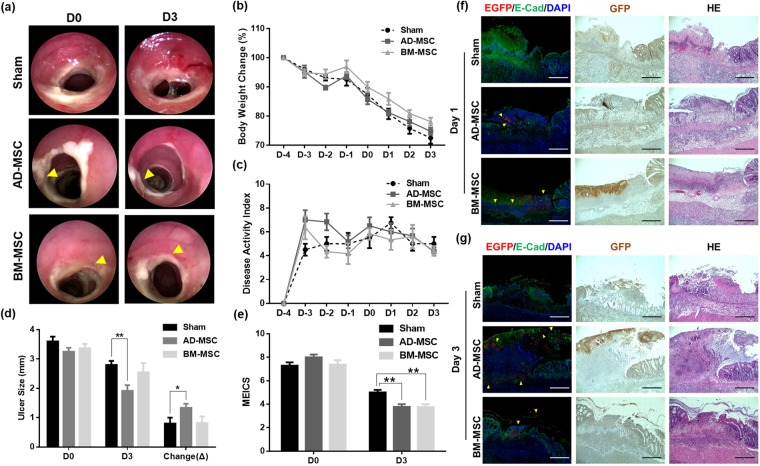
Figure 5.
Evaluation of MSC sheets endoscopic transplantation in DNBS colitis model. (a) Endoscopic images of MSC sheets transplantation in DNBS colitis model. The yellow arrow points to the transplantation site. (b) The time-course body weight change on transplanted and non-transplanted MSC sheets. (c) The evaluation of animal model clinical severity assessed by DAI scores. DAI calculated by the combined score of weight loss, stool consistency, and bleeding, as detailed in Table 1. (d) The changes in ulcer size before and after D0 between D3 (±SEM n = 12, each). **P < 0.01, *P < 0.05. (e) Endoscopic score changes of D0 and D3. D0; transplantation day, D3; 3 days after transplantation (±SEM n = 12, each). **P < 0.01. Sham: transplantation of CELLSHIFTER without MSC sheets, AD-MSC; AD-MSC sheets transplanted, BM-MSC; BM-MSC sheets transplanted. (f) Histological analysis of colon tissue 1 day after MSC sheets. (middle; AD-MSC, lower; BM-MSC) attachment group. (g) Histological analysis of colon tissue 3 day after MSC sheets. (middle; AD-MSC, lower; BM-MSC) attachment group. Sham; transplanted CELLSHIFTER without MSC sheets, AD-MSC; AD-MSC sheets transplanted, BM-MSC; BM-MSC sheets transplanted. The red fluorescent signal is an EGFP signal in immunofluorescence, Dark brown stain was EGFP signal in DAB stain. GFP/E-Cad/DAPI; immunofluorescence stain, Brown GFP; immunohistochemistry, HE; Hematoxylin and eosin stain. Bars represent 200 μm.

