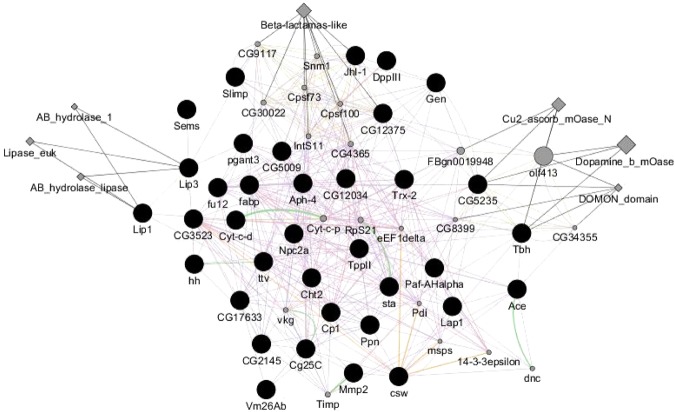
Figure 2.
Gene interaction analysis [co-expression (purple), co-localization (light blue), physical interactions (orange), genetic interactions (green) and consolidated pathways (grey)] performed with F. candida’s differentially expressed transcripts after exposure to the herbicide formulation for 10 days. Protein domain attributes and genes related to query genes are presented in grey nodes and query genes presented in black nodes. Interaction analysis was performed with the list of Drosophila melanogaster genome homologous genes to F. candida, using GeneMANIA plugin from Cytoscape software (version 3.4.0).

