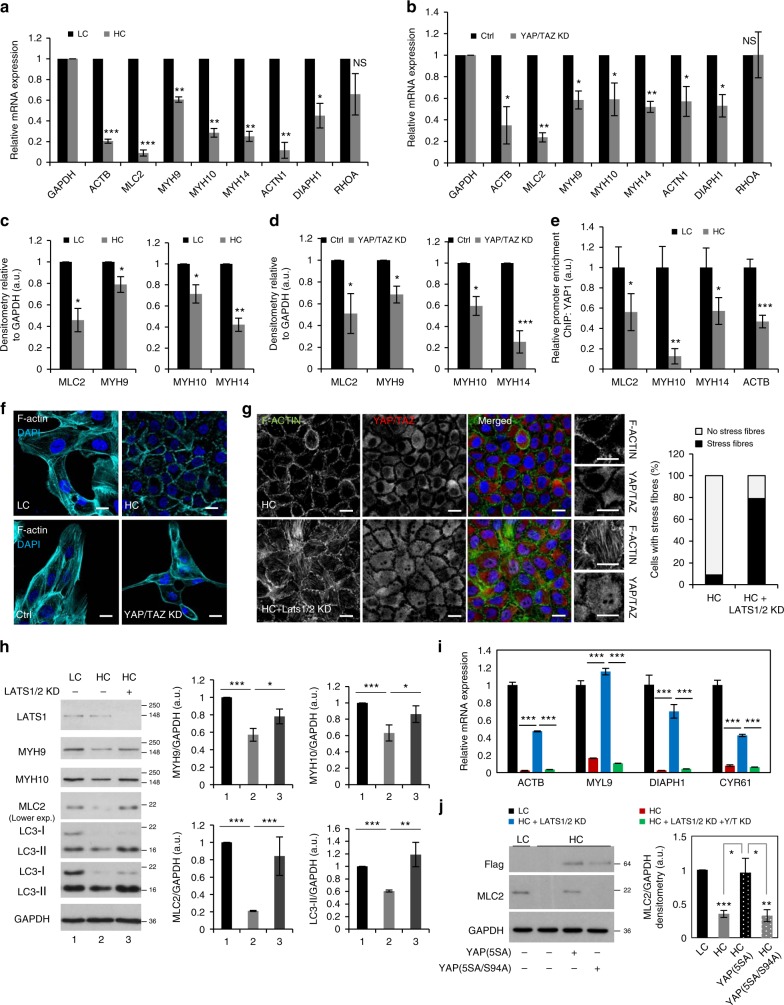
Fig. 2.
High confluent cells show dramatic reduction of stress fibers formation and have low expression of actomyosin proteins via YAP/TAZ inhibition. a mRNA levels of the indicated proteins relative to GAPDH (control) in MCF10A cells plated at different confluencies: LC and HC. b mRNA levels of the indicated proteins relative to GAPDH (control) in MCF10A cells treated with YAP/TAZ siRNAs. c Densitometry of the indicated protein levels relative to GAPDH (control) in MCF10A cells plated at different confluencies: LC and HC. d Densitometry of the indicated protein levels relative to GAPDH (control) in MCF10A cells treated with YAP/TAZ siRNAs. e Relative promoter enrichment in YAP of the indicated genes. MCF10A cells were seeded at LC and HC and subjected to ChIP:YAP analysis. Bars represent the mean ± s.d. of one representative experiment performed in triplicates (***P < 0.001, **P < 0.01, *P < 0.05; two-tailed t-test). The experiment was repeated at least another 2 times with similar results. f Representative images of F-actin (Phalloidin) immunostaining in MCF10A cells plated at low and high confluencies and exposed to either Ctrl or YAP/TAZ double knockdown. Scale bar is 10 µm. g Representative images of F-actin (Phalloidin) immunostaining in MCF10A cells plated at high confluency and treated with LATS1/2 siRNAs. The number of cells with stress fibers is rescued by LATS1/2 KD (see right panel). h Representative western-blots for the indicated proteins in MCF10A cells plated at high confluency and treated with LATS1/2 siRNAs. The levels of the indicated proteins are rescued by LATS1/2 KD. i Relative mRNA levels of the indicated genes to GAPDH in MCF10A cells exposed to LATS1/2 and/or YAP/TAZ siRNAs. The treated cells were seeded at low and high confluencies. Bars represent the mean ± s.d. of one representative experiment performed in triplicates (***P < 0.001; two-tailed t-test). j MCL2 levels assessed by immunoblotting in HeLa cells plated at different confluencies and overexpressing control (Ctrl), YAP(5SA) or YAP(5SA/S94A). GAPDH was used as loading control. MLC2/GAPDH densitometry is displayed on the right panel. The graphs show the mean ± s.e.m. (n = 4; ***P < 0.001, **P < 0.01, *P < 0.05; two-tailed one sample t-test). Unless otherwise stated, bars—mean ± s.d. (n = 3;***P < 0.001, **P < 0.01, *P < 0.05, NS, not significant; two-tailed one sample t-test). n = number of independent biological replicates unless otherwise stated

