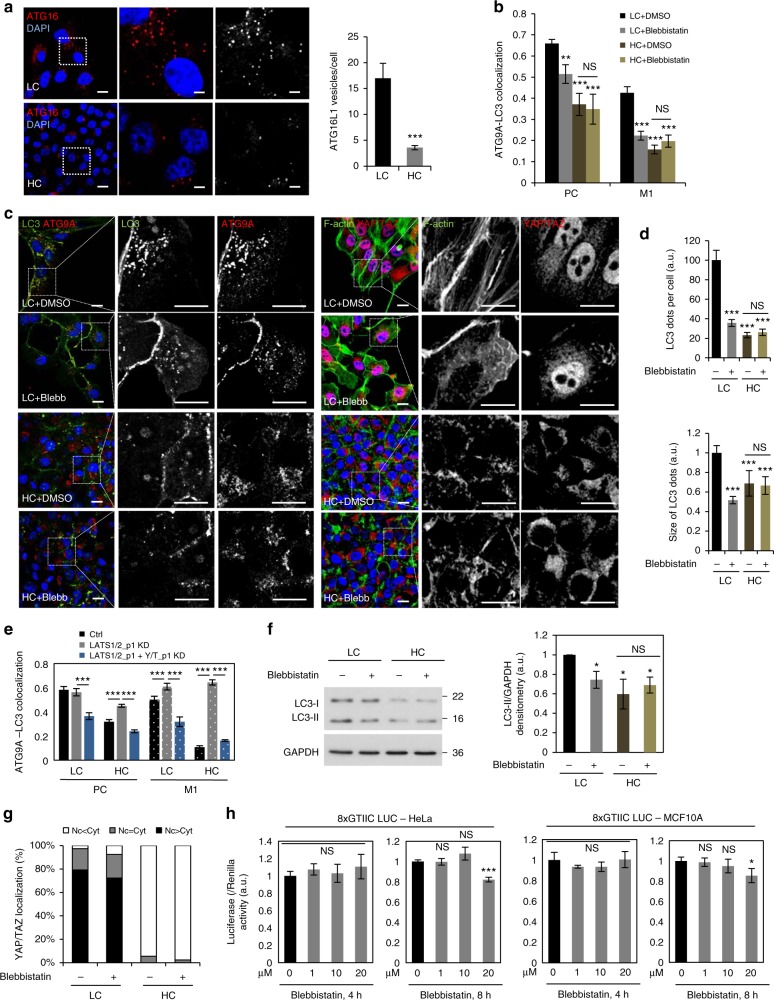
Fig. 3.
Myosin-II inhibition reduces autophagosome biogenesis in low confluency cells. a Representative images of endogenous ATG16L1 vesicles in MCF10A cells. Scale bar is 10 µm. Right panel: quantification of ATG16L1 vesicles numbers in LC and HC. At least 20–30 cells were quantified per condition. b ATG9A—LC3 colocalization in MCF10A cells. MCF10A cells plated at low and high confluencies were exposed to either DMSO (vehicle control) or blebbistatin (20 µM) for 4 h. The Pearson’s correlation and Manders’ overlap (the amount of LC3 in the ATG9 compartment) coefficients were used to measure the colocalization of LC3 with ATG9A in >30 cells per condition. c Representative confocal images of LC3 - ATG9A and z-stack images of F-actin and YAP/TAZ double immunostainings in MCF10A cells treated as in b. Scale bar is 10 µm. d Number and size of LC3 dots per cell in MCF10A cells plated at various densities and exposed to either DMSO (vehicle control) or blebbistatin (20 µM) for 4 h. Representative images–see b. More than 30 cells were analyzed per condition using ImageJ. e ATG9A—LC3 colocalization in MCF10A cells plated at LC or HC confluencies and exposed to either LATS1/2_p1 alone or combined with YAP/TAZ_p1 siRNAs. The Pearson’s correlation and Manders’ overlap (the amount of LC3 in the ATG9 compartment) coefficients were used to measure the colocalization of LC3 with ATG9A (for LC: n = 25 cells, while for HC: n = 100 cells). See Supplementary Fig. 10 for representative images. a–e Bars—mean ± s.e.m. (***P < 0.001, **P < 0.01, *P < 0.05, NS, not significant; two-tailed t-test). f Representative LC3-II immunoblots for MCF10A cells treated with blebbistatin (20 µM, 5 h). LC3-II/ GAPDH densitometry in MCF10A cells exposed to blebbistatin (20 µM, 5 h)–bottom panel. Bars—mean ± s.d. (*P < 0.05, NS, not significant; two-tailed one sample t-test). g YAP/TAZ localization in MCF10A cells treated as in b, c. There is no dramatic difference in YAP/TAZ localization between control and blebbistatin-treated cells. h Luciferase assay for YAP/TAZ activity in HeLa and MCF10A cells exposed to increasing concentrations of blebbistatin for 4 and 8 h, respectively. Bars–mean ± s.d. (n = 3, ***P < 0.001, *P < 0.05, NS, not significant; two-way ANOVA). n = number of independent biological replicates unless otherwise stated

