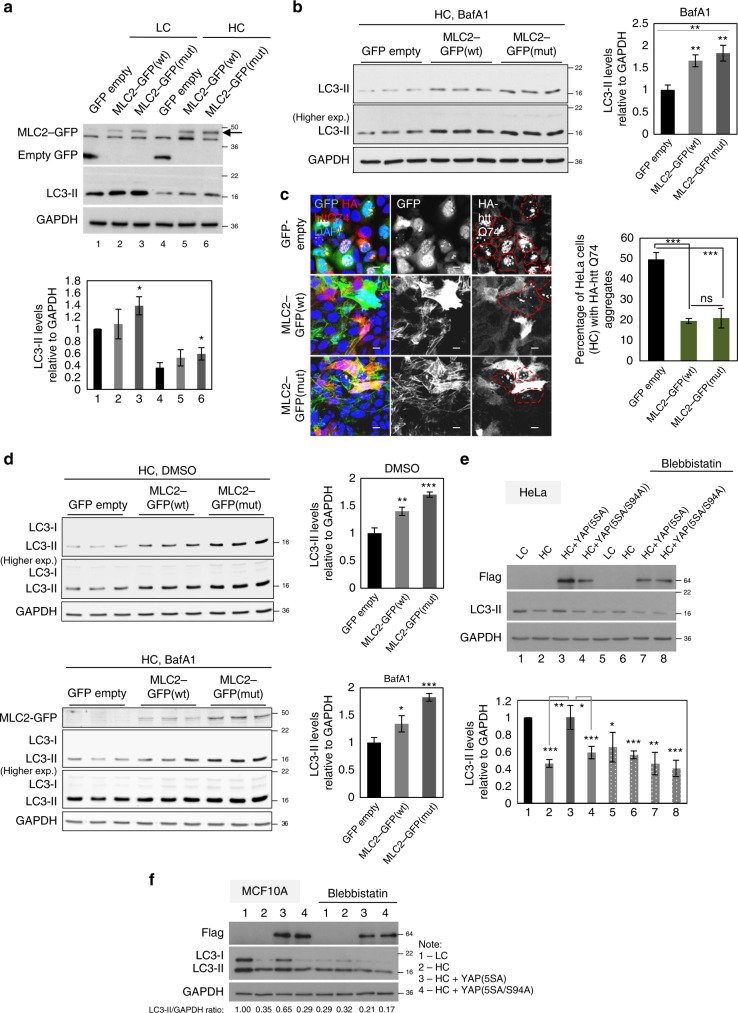
Fig. 4.
The autophagy inhibition caused by high cell density is myosin II –dependent. a Representative LC3-II western-blots of HeLa cells overexpressing either the wild-type or the constitutively active MLC2 (T18D, S19D—mut) construct. The graphs show the LC3-II/GAPDH: means ± s.d. (n = 3; *P < 0.05; two-tailed one sample t-test). b Representative LC3-II western-blots of high confluency HeLa cells overexpressing either the wild-type or the constitutively active MLC2 (T18D, S19D - mut) construct. The cells were exposed to BafA1 (400 nM). The graphs show the LC3-II/GAPDH: means ± s.d. (n = 3; **P < 0.01; two-way ANOVA). c Representative HA-htt Q74 aggregates in high confluency HeLa cells overexpressing either the wild-type or the constitutively active MLC2 (T18D, S19D - mut) construct. The graphs show the percentage of cells with HA-htt Q74 aggregates: means ± s.d. (n = 3; ***P < 0.001, NS, not significant; two-way ANOVA). d Representative LC3-II western-blots of high confluency MCF10A cells overexpressing either the wild-type or the constitutively active MLC2 (T18D, S19D - mut) construct. The cells were exposed to either DMSO or BafA1 (400 nM). The graphs show the LC3-II/GAPDH: means ± s.d. (n = 3; ***P < 0.001, **P < 0.01, *P < 0.05; two-way ANOVA). e Representative LC3-II western-blots of HeLa cells overexpressing control (empty flag), YAP(5SA) or YAP(5SA/S94A) exposed to either vehicle (DMSO) or blebbistatin treatment. Bars represent the mean ± s.d. (n = 3; ***P < 0.001, **P < 0.01, *P < 0.05; two-tailed one sample t-test). f Representative LC3-II western-blots of MCF10A cells overexpressing control (empty flag), YAP(5SA) or YAP(5SA/S94A) exposed to either vehicle (DMSO) or blebbistatin treatment. n = number of independent biological replicates unless otherwise stated

