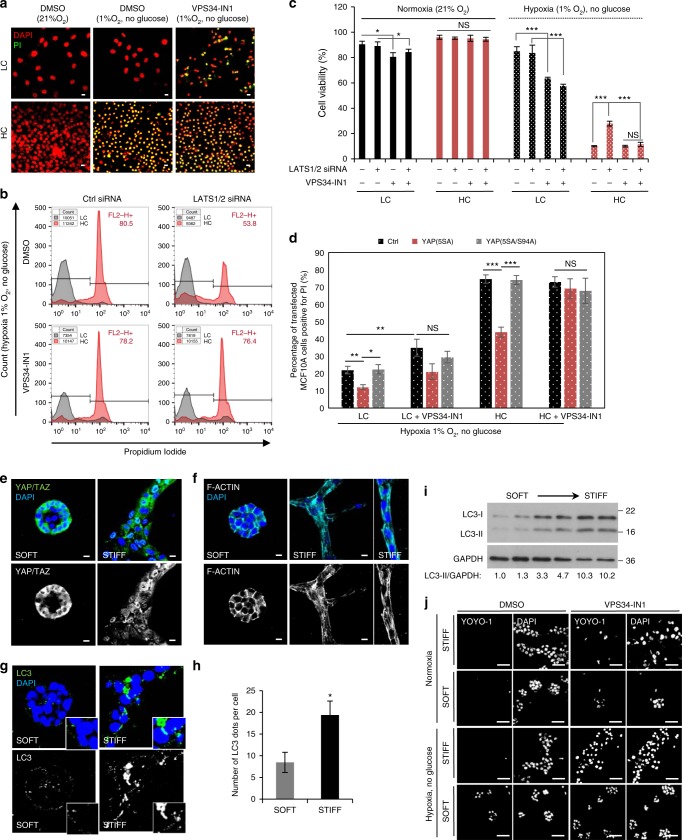
Fig. 7.
Effects of soft ECM vs. stiff ECM on autophagy regulation. a Representative propidium iodide (PI, shown in green) and DAPI (shown in red) staining in MCF10A cells plated at low/ high densities and cultured for the last 24 h in hypoxia and no-glucose conditions, ±VPS34-IN1. The green and red colors were chosen to increase the images’ visibility. b Propidium iodide (PI) analysis by flow cytometry in MCF10A cells exposed to LATS1/2 siRNAs and then plated at low/ high densities. For the last 24 h, the cells were grown in hypoxia and no glucose conditions, ±VPS34-IN1 (1 µM). c Cell viability analysis using the annexin5-FITC/PI method. MCF10A cells were exposed to LATS1/2 siRNAs and then plated at low/ high densities. For the last 24 h, the cells were grown in either normoxia or hypoxia and no-glucose conditions, ±VPS34-IN1 (1 µM). Bars—means ± s.d. (n = 3; *P < 0.05, ***P < 0.001; two-tailed t-test). d Propidium iodide (PI) staining and cell viability data measured by flow cytometry in high confluency MCF10A cells overexpressing control (empty flag vector), YAP(5SA) or YAP(5SA/S94A). For the last 24 h, the cells were grown in hypoxia and no-glucose, ±VPS34-IN1 (1 µM). Bars—mean ± s.e.m. (n = 4; ***P < 0.001, **P < 0.01, *P < 0.05; two tailed t-test). e Representative images of YAP/TAZ staining in MCF10A cells plated on either soft or stiff ECM. f Representative images of F-actin immunostaining in cells treated as above. g Representative images of endogenous LC3 in MCF10A cells seeded on either soft or stiff ECM. h Quantification of endogenous LC3 dots in MCF10A cells seeded on either soft or stiff ECM. Bars—mean ± s.e.m. (n = 4; *P < 0.05; two-tailed t-test), from one representative experiment, where 4 distinct structures of 15–20 cells each where analyzed. i Representative LC3-II immmunoblot in MCF10A cells seeded on ECM with different stiffnesses. j YOYO-1 staining of MCF10A cells plated on soft or stiff matrixes. For the last 24 h, the cells were grown in hypoxia and no-glucose, ±VPS34-IN1 (1 µM). Scale bars—50 µm. See Supplementary Fig. 18c for quantification of cell apoptosis.Unless otherwise stated, scale bar is 10 µm. n = number of independent biological replicates unless otherwise stated

