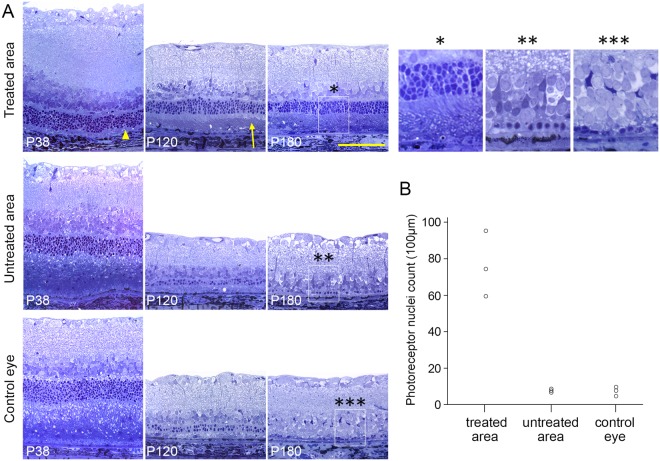
Figure 2.
Histology of surgically treated and control eyes. (A) Upper row: histology of the 38, 120, and 180-day old RCS rats in the surgically-treated area. Middle row: untreated retina in the same eye. Bottom row: and contralateral control eye. Treated retina exhibited much thicker ONL than both controls. Note that after subretinal lavage, subretinal debris was removed (P38, arrow head) and outer-segments reappear (P120, arrow). (B) Number of the photoreceptor nuclei per 100 µm in the surgically treated retina, untreated retina, and control eye (n = 3 control eyes and 3 treated eyes in 3 animals).

