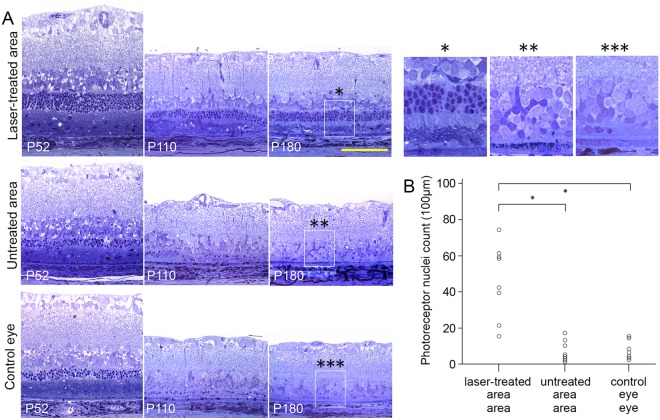
Figure 5.
Histology of the laser-treated and control eyes. (A) The representative histology of 52, 110, and 180-day old RCS rat retinas from laser-treated area (upper row), untreated retina in the same eye (middle row), and contralateral control eye (bottom row). Much thicker ONL is evident in the treated area than in both controls. (B) Number of the photoreceptor nuclei per 100 µm in the laser-treated retina, untreated retina, and control eyes (n = 8 control eyes and 8 treated eyes in 8 animals, error bars - s.e.m; *p < 0.001, two-sided paired t-test).

