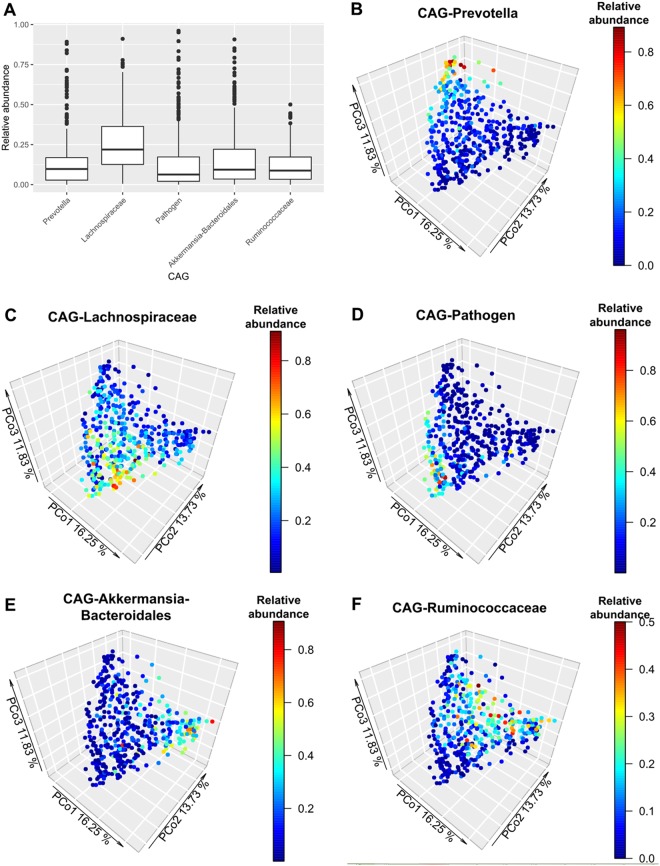
Figure 3.
Abundance distribution of co-abundance groups (CAGs). (A) Distribution of the relative abundance of each CAG in the studied population (n = 441). (B–F) Principal coordinate analysis (PCoA) based on weighted UniFrac distances describing the enterogradient of the studied population (n = 441). The different panels show the same cloud point colored by the relative abundance of each co-abundance group (CAG). (B) Prevotella-CAG, (C) Lachnospiraceae-CAG, (D) Pathogen-CAG, (E) Akkermansia-Bacteroidales-CAG, (F) Ruminococcaceae-CAG. Percentages on the axes represent the proportion of the explained variation of each component of the PCoA. Note the change in the relative abundance scale among panels.

