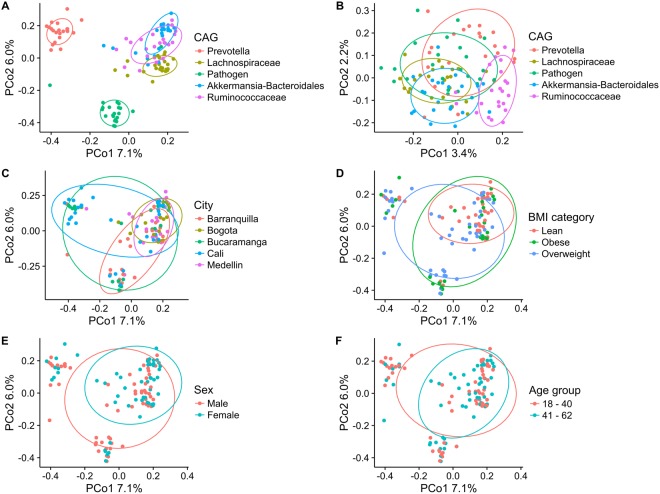
Figure 4.
Composition of the total microbial community within the single-CAG dominated microbiota (n = 114) according to co-abundance groups (CAGs) (A,B), Colombian city of origin (C), BMI (D), sex (E) and age range (F). All principal coordinate analyses (PCoA) were based on weighted UniFrac distances except in panel B (unweighted UniFrac). Ellipses encompass 75% of the variation. Percentages on the axes represent the proportion of explained variation of each component of the PCoA.

