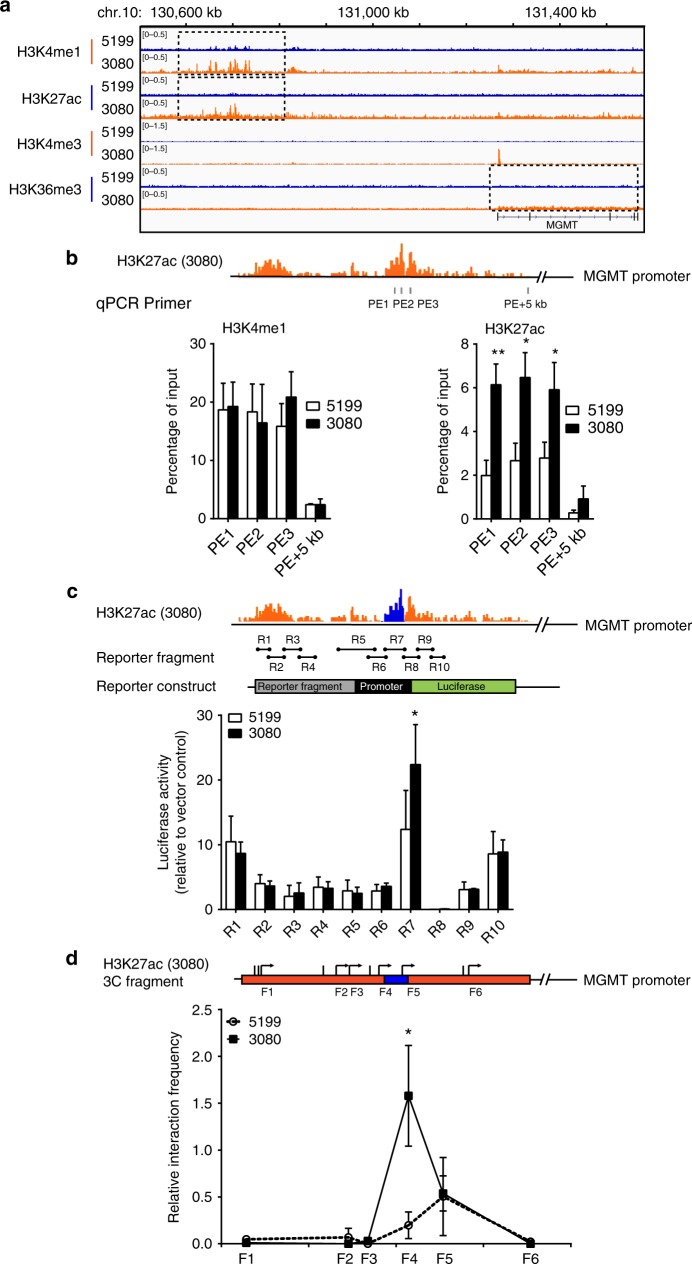
Fig. 2.
Delineation of a putative enhancer-associated with MGMT gene in 3080 subline. a IGV snapshots showing H3K4me1, H3K27ac, H3K4me3, and H3K36me3 ChIP-seq reads density at the putative enhancer region, MGMT promoter, and gene body in 5199 (TMZ-sensitive) and 3080 (TMZ-resistant) xenograft lines. b H3K4me1 (bottom left) and H3K27ac (bottom right) occupancy at the putative K-M enhancer in 5199 (parental) and 3080 (TMZ-resistant) xenograft tumors were analyzed by ChIP-qPCR. Three different sets of primers (PE1-3) were designed to analyze against putative enhancer region. A set of primers amplifying 5 kb away from the putative enhancer (PE + 5 kb) was used as negative control. Top: magnified view of H3K27ac ChIP-read peaks and the location of each primer set. c Effect of each fragment on transcription of luciferase reporter gene in 5199 and 3080 cells. Fragments R1–R10 covering putative enhancer region (top) were cloned upstream of luciferase promoter (middle). The ChIP-seq peak covered by R7 region is labeled in blue. Each construct was transfected into 5199 or 3080 cells along with a plasmid expressing Renilla luciferase. Firefly and Renilla luciferase activities were measured 36 h after transfection. Luciferase activity was normalized to the Renilla luciferase activity (internal control) first and subsequently normalized to an empty vector control. d Enhancer–promoter interaction analyzed by chromatin conformation capture (3C) assay. Relative interaction frequency of each restriction fragment (F1–F6) was calculated as described in the experimental procedures and was plotted on genomic location of the 3′ cutting site of each fragment (X axis). Values reported were derived from three biological repeats (*p < 0.05, **p < 0.01, Student’s t test). The genomic region covered by H3K27ac peak is labeled in orange, location of R7 fragment was colored in blue to highlight the overlap with the F4 fragment

