Fig. 3.
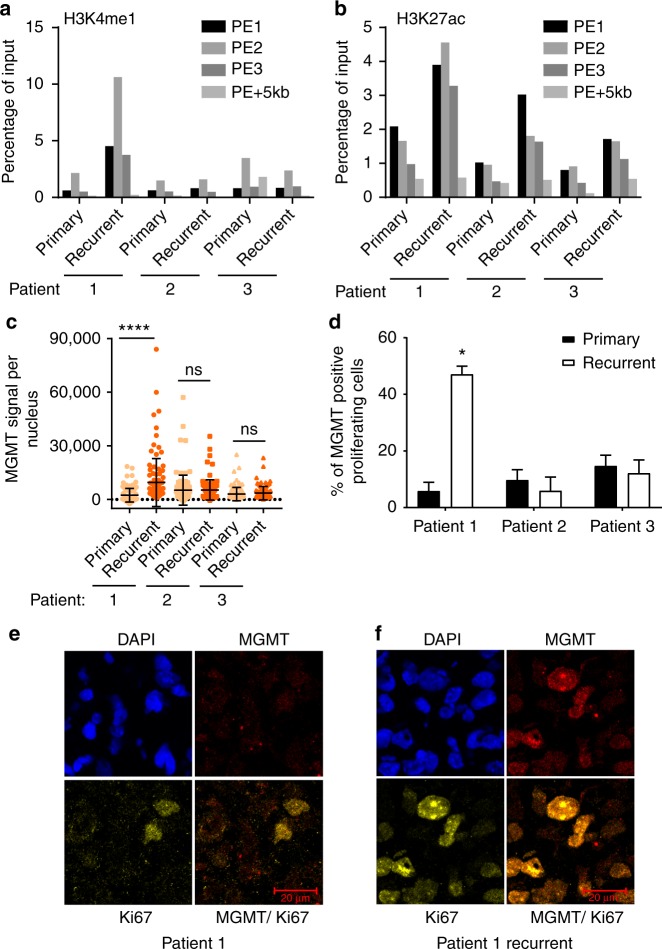
Enhancer activity and MGMT expression in three pairs of GBM patient samples. a, b Relative occupancy of H3K4me1 (a) and H3K27ac (b) in the K-M enhancer region in primary and matched recurrent tumors from three GBM patients was analyzed by ChIP-qPCR using primers described in Fig. 2. c MGMT expression level in each tumor was analyzed by immunofluorescence. The MGMT signal (area × average intensity) from 100 individual nuclei was measured and one-way ANOVA was used for the calculation of significance (****p < 0.0001, ns not significant, n = 100) d Analysis of MGMT expression in proliferating tumor cells. Multicolor immunofluorescence was performed using antibodies against CD45, Ki67, and MGMT. Proliferating tumor cells (Ki67 staining without CD45 staining) were identified and the percentage of MGMT-positive proliferating cells was calculated. Two-tail paired Student's t test was used for calculation of significance (*p < 0.05). e, f Representative images showing co-localization of MGMT and Ki67 in tissue sections from primary tumor (e) and recurrent tumor (f) obtained from patient #1

