Fig. 4.
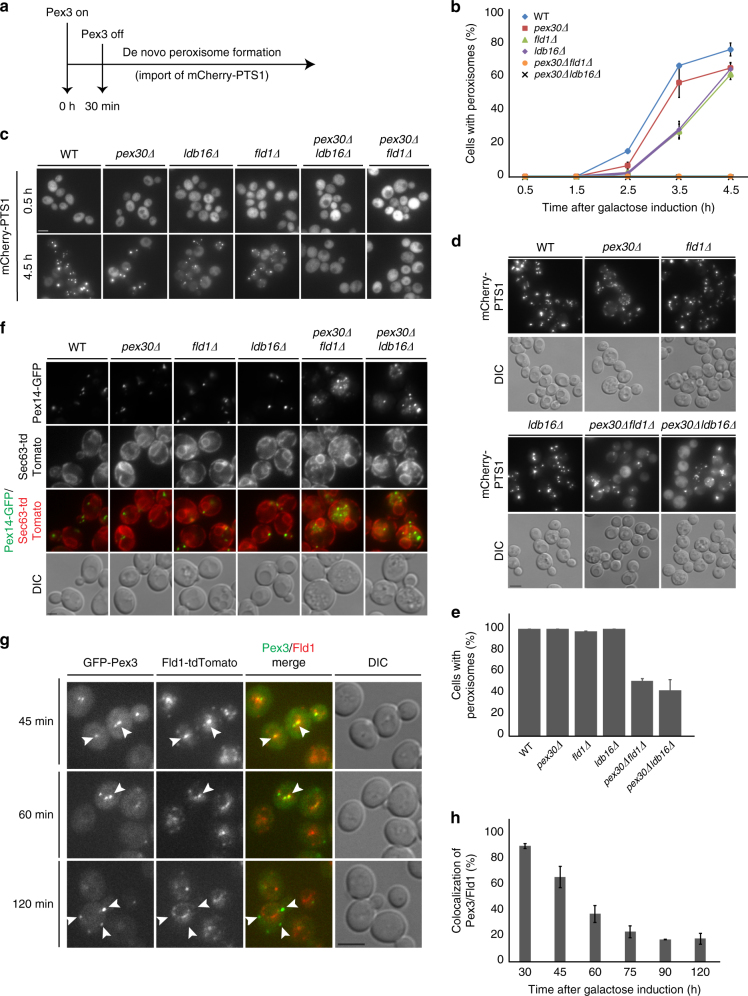
Pex30 and seipin cooperate during peroxisome biogenesis. a Schematic of de novo peroxisome biogenesis induction by pulse of GFP-Pex3 expression, as described39. b Quantification of de novo peroxisome biogenesis as described in a in cells with the indicated genotype. Graphs correspond to the average of two experiments. Error bars indicate the SD. c De novo peroxisome biogenesis in cells with the indicated genotype. Representative images of time points 0.5 and 4.5 h are shown. Bar 2 µm. d Distribution of functional peroxisomes in cells with the indicated genotype analyzed by steady-state localization of the matrix marker mCherry-PTS1. Bar 2 µm. e Quantification of cells of the indicated genotype with functional peroxisomes, as measured by the presence of mCherry puncta corresponding to matrix-imported mCherry-PTS1. The average of two experiments is shown; error bars display standard deviation; > 100cells/genotype/experiment were counted. f Single focal plane images of cells with the indicated genotype co-expressing endogenously tagged Pex14-GFP and the ER marker protein Sec63-tdTomato. Bar 2 µm. g Pex3 and Fld1 transiently colocalize during de novo peroxisome biogenesis. Fld1 was tagged with tdTomato (Fld1-tdTomato) and expressed from the endogenous locus. Representative images of the indicated time point according to a are shown. White arrows show bright Pex30 foci that colocalize with Fld1 at 45 min and 60 min, but not 120 min. Bar 2 µm. h Quantification of Pex3 and Fld1 colocalization during de novo peroxisome biogenesis, assayed as describe in a. The average of two experiments is displayed; error bars represent SD; > 100cells/genotype/experiment were counted

