Fig. 5.
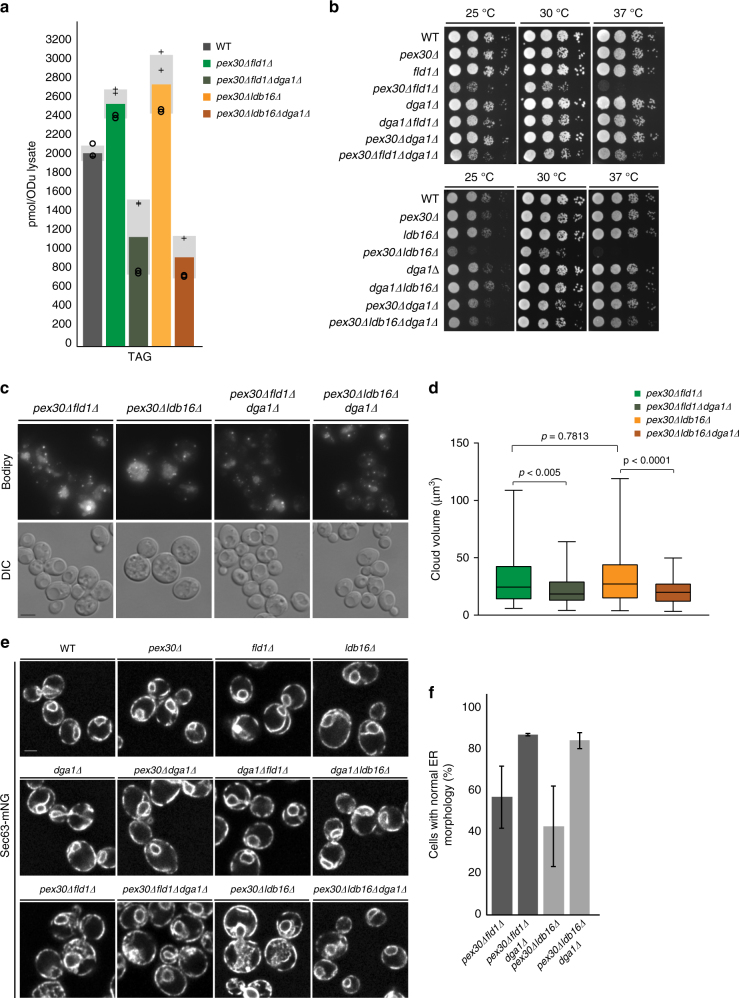
Absence of Pex30 and seipin results in toxic TAG accumulation in ER membranes. a TAG levels in cells with the indicated genotype, as determined by mass spectrometry. Graph corresponds to the average of two biological (+ and ○) and two technical repeats. The four individual measurements are displayed. Light gray bars indicate SD. b Tenfold serial dilutions of cells with the indicated genotype were spotted on YPD plates and incubated at 25 °C, 30 °C, or 37 °C for 2 days. c Cells with indicated genotype were stained with the neutral lipid dye Bodipy493/503. Bar 2 µm. d The volume of dispersed Bodipy structures in cells with the indicated genotype were quantified. Unpaired Mann–Whitney test was used to determine p-values. e ER morphology in cells with the indicated genotype. ER was visualized by endogenously expressed Sec63-mNG. Bar 2 µm. f Quantification of cells with abnormal ER morphology, as determined by microscopy. The average of two experiments is shown; error bars represent SD; > 100cells/genotype/experiment were counted

