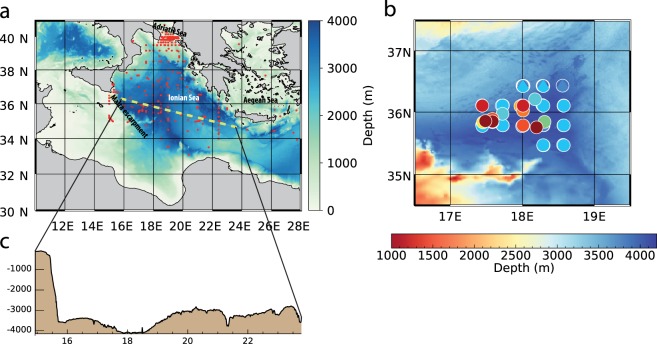
Figure 1.
The study area. (a) Bathymetry of the Ionian Sea. The red dots indicate the CTD casts we consider in this work (collected from 1977 to 2011); the yellow line indicates the bathymetric section of panel (c). (b) Zoom-in of the study area with the deep CTD casts (those reaching 4000 m depth); colors correspond to the temperature and salinity profiles in Figs 2a,b and 4a. Maps are generated by IDL 8.0 (www.harrisgeospatial.com/IntelliEarthSolutions/GeospatialProducts/IDL.aspx).

