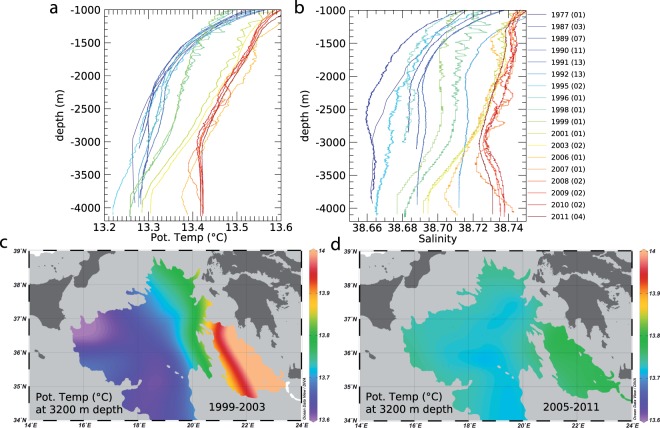
Figure 2.
Hydrographic results. (a) Temperature profiles. (b) Salinity profiles; colors indicate the year of data collection, as also reported in Fig. 4a while in parenthesis we report the number of stations that were averaged in the same year. (c) Horizontal temperature map at 3200 m depth, as obtained from CTD measurements collected from 1999 to 2003. (d) Horizontal temperature map at 3200 m depth, as obtained from CTD measurements collected from 2005 to 2011. Figure created using Ocean Data View software (ODV - version, 4.7.4., Schlitzer, R., Ocean Data View, odv.awi.de, 2017).

