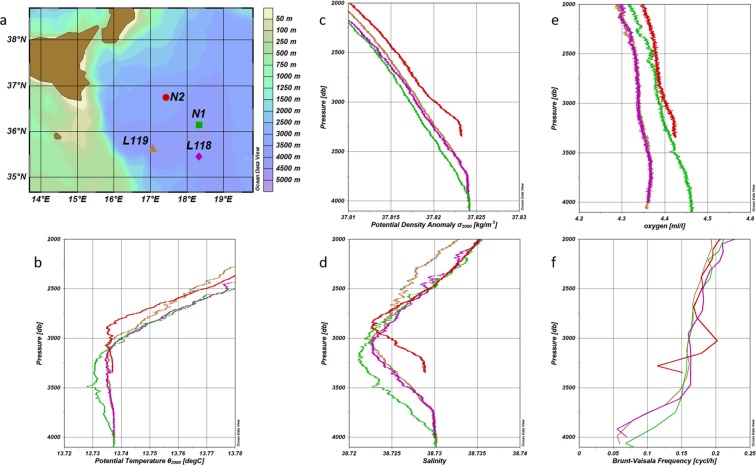
Figure 3.
Hydrographic characteristics of the 2011 dataset. (a) Geographic location of the stations N1, N2, L118, and L119. (b) Potential temperature profiles for the four stations. (c) Potential density anomaly profiles for the four stations. (d) Salinity profiles for the four stations. (e) Oxygen profiles for the four stations. (f) Brunt–Väisälä frequency profiles for the four stations. Colours refer to the stations in panel (a). Figure created using Ocean Data View software (ODV - version, 4.7.4., Schlitzer, R., Ocean Data View, odv.awi.de, 2017).

