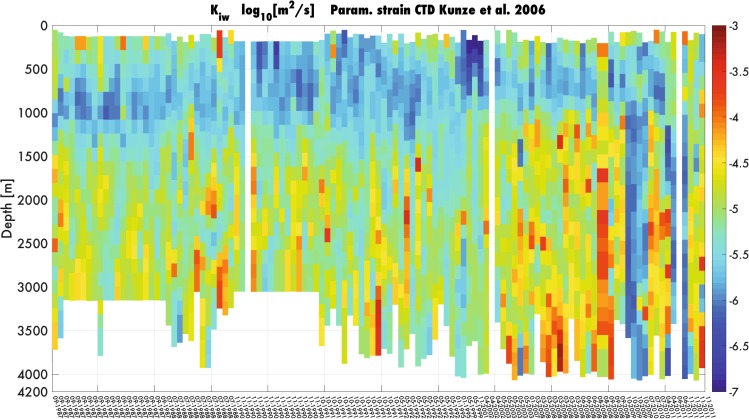
Figure 4.
Hovmöller diagram of the kinetic turbulent diffusion rate (KIW). The diffusion rate is calculated from equation (1), by using the Osborn-Cox relation32. We use here vertical segments of 320 m. Segments are defined along the vertical grid from the bottom to 50 m from the surface to avoid contamination by surface processes. Signal is de-trended and a Tukey windowing is applied. Variance loss is corrected by multiplying by a factor 1.07. The Hovmöller diagram shows an increase of bottom-induced kinetic turbulent diffusion rate from the onset of the 2003, where the post-EMT baroclinc structure appears in the bottom layer (see Fig. 5b).

