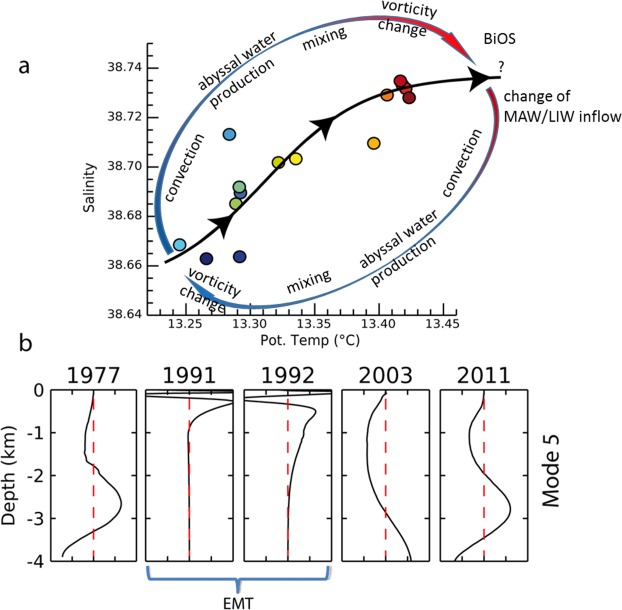
Figure 5.
Equilibrium states and baroclinic modes. (a) T-S diagram highlighting the two different states of the deep Ionian Sea (i.e., fresh and cold during the period 1977–1999, salty and warm from the 2003). The loop qualitatively schematizes all the processes that would be involved in the hypothesized hysteresis cycle: convection brings to abyssal water production; mixing processes due to bathymetric constraints bring then to the decay of vorticity (see Fig. 6b) in the bottom layer that would bring to Adriatic-Ionian Bimodal Oscillating System (BiOS) [ref.5]; this, in turn, regulates the inflow of Modified Atlantic and Levantine Intermediate waters (MAW and LIW, respectively). (b) The 5th baroclinic mode as obtained from the CTD casts (see text); starting from the 1977, where two equivalent depths are observed at 2000 and 3200 m depth, the panel shows that the EMT stretched baroclinic structures upward, removing the baroclinicity in the deep layers; the onset of a baroclinc structure in the bottom layer appears again from 2003 (see Fig. 4) while the 2011 shows similar equivalent depths of those observed in 1977. Figure created using IDL 8.0 (www.harrisgeospatial.com/IntelliEarthSolutions/GeospatialProducts/ IDL.aspx).

