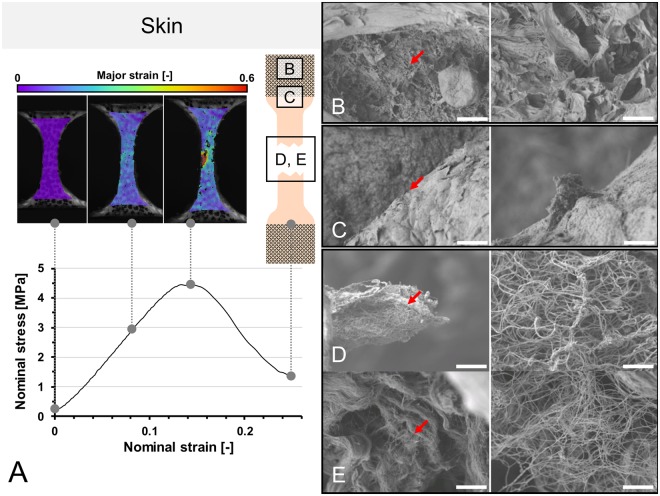
Figure 7.
(A) Stress-strain curve of human calvarian skin and the corresponding strain fields from digital image correlation in three steps before the specimen fails. A schematic sample with squares indicates the area where tissues were removed for electron microcopy. (B–E) Scanning electron microscopy of human calvarian skin. Left side 500x magnification (scale bar 40 μm), right side 5,000x magnification (scale bar 4 μm), red arrows indicate the area of magnification for the right picture. (B) Clamping area. Images correspond to skin obtained from the upper parietal bone area of an infant male. Partially ruptured keratin sheets in low magnification. Partial collagen fiber rupture can furthermore be seen in higher magnifications. (C) Edge area. Images correspond to skin obtained from the upper occipital bone area of a geriatric male. Partially ruptured keratins can be seen in low magnification. In higher magnifications, ruptured collagen bundles are found surrounded by keratin sheets. (D) Failure area. Images obtained from upper parietal bone area of a geriatric male. In this area, mainly collagen bundles were found, with both retracted and intact areas, building a dense network. (E) Failure area. Obtained from the area upper superficial to the occipital bone of an infant male. At lower magnifications, a similar pattern can be seen as in the geriatric sample. At higher magnifications, it can be seen that a similar area is composed of lesser collagen at a lower density but higher quantity, which may be partially responsible for higher elasticity and lower ultimate stress features.

