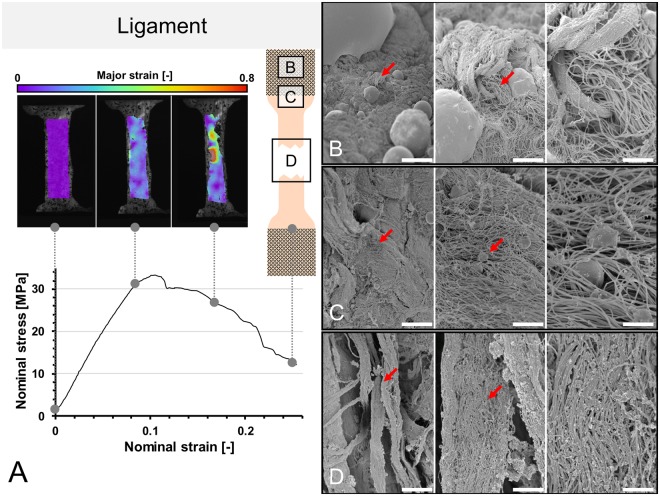
Figure 8.
(A) Stress-strain curve of human ligament and the corresponding strain fields from digital image correlation in three steps before the specimen fails. A schematic sample with squares indicates the area where tissues were removed for electron microcopy. (B–D) Scanning electron microscopy of ligament samples. Left side 1,000x magnification (scale bar 20 μm), middle 5,000x magnification (scale bar 2.5 μm), right side 15,000x magnification (scale bar 1 μm), red arrows indicate the area of magnification for the next picture. (B) Clamping area. Images correspond to the area under the pyramids of the clamps. Collagen fibers remained partially to fully intact in all magnifications. (C) Edge area. Intact and partially ruptured collagen fibers are seen, indicated by disruption of fibers and ball-shaped collagens in higher magnifications. (D) Failure area. Lumpy collagen appearance, collagen disarrangement and collagen balls indicate multiple sites of rupturing in the failure areas.

