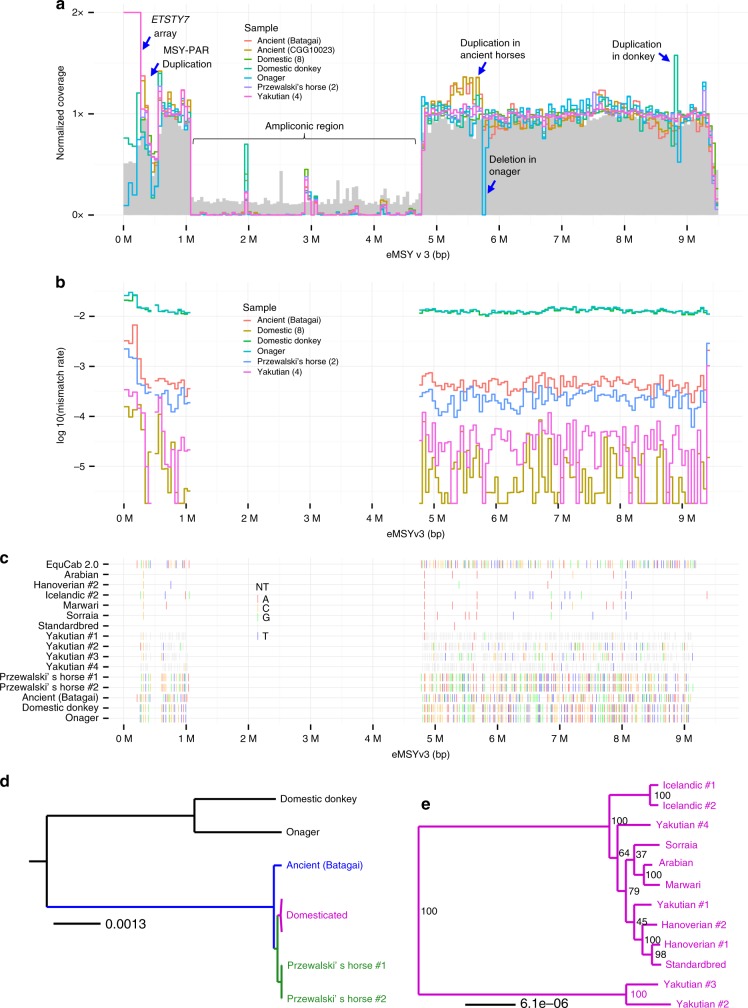
Fig. 7.
Comparison of equid MSY. a Normalized coverage for each group of samples in 1 kbp blocks. Mappability (between 0 and 1) is shown in gray. b Average mismatch rates (relative to reference sequence) in 1 kbp blocks. c Variable sites in eMSY. Only sites called in the eMSY sequence and covered in at least one individual in each group are shown. EquCab 2.0 shows the nucleotide observed on eMSY, while rows for individuals show the SNP observed at that site for an individual, or nothing if the reference nucleotide is observed. Gray indicates sites not called in that individual. d and e Maximum likelihood phylogenies generated from supermatrix of high-mappability genomic blocks for equids and horse breeds, respectively

