Figure 6.
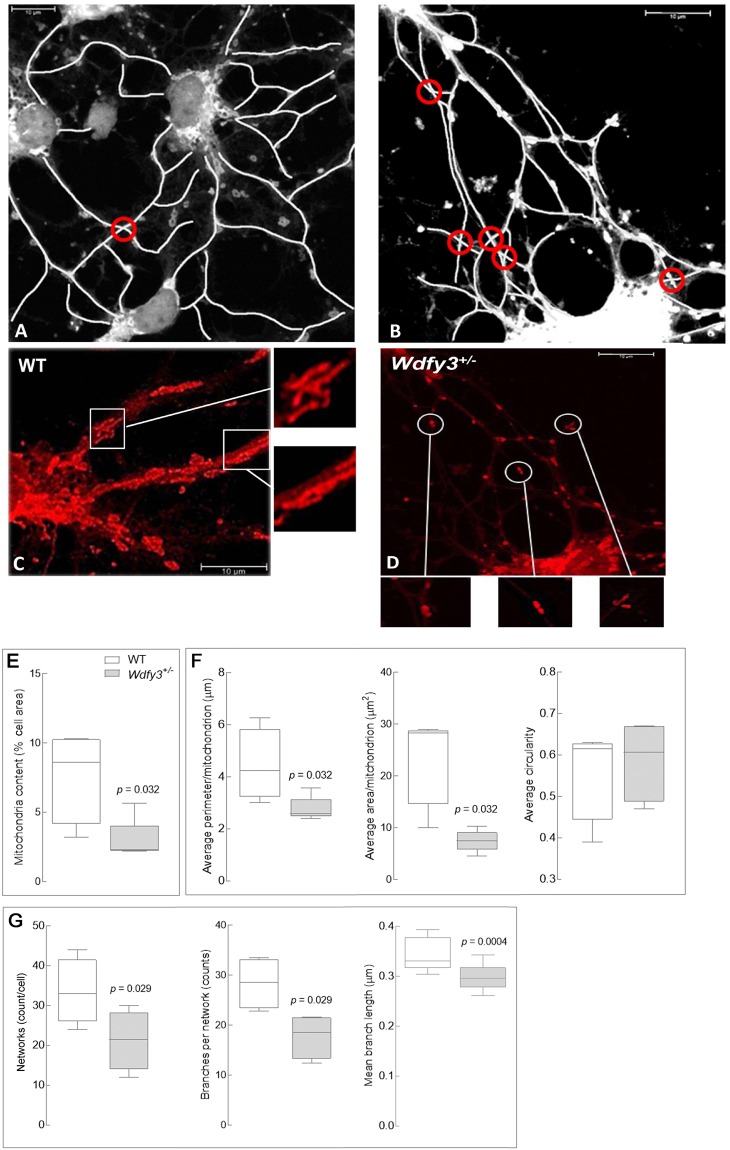
Mitochondrial morphology, distribution and projection pattern of cortical primary neurons in Wdfy3-haploinsufficient mice. Mitochondrial staining of primary cortical neurons from WT (A,C) or Wdfy3-haploinsufficient mice (B,D) was performed with MitoTracker and images recorded with an Olympus FV1000 confocal microscope at 60X magnification, as described in the Methods Section. A tubular, elongated pattern is evident in mitochondria from WT (C, insets) whereas Wdfy3+/lacZ neurons show fewer, smaller mitochondria and budding protrusions (D, insets). Overlapping projections (panels A,B, circled in red) were visualized with ImageJ and their frequencies counted manually. (E,F) Quantification of the mitochondria content [percentage of cellular area covered by mitochondria, (E)] and mitochondrial morphology (F) were performed used a macro for ImageJ (see Methods). (G) Number of networks per cell and number of branches per network were evaluated with the MiNA macro (see Methods). Statistical analysis was performed with a 2-tailed Mann-Whitney test. Significance was considered with p values < 0.05.

