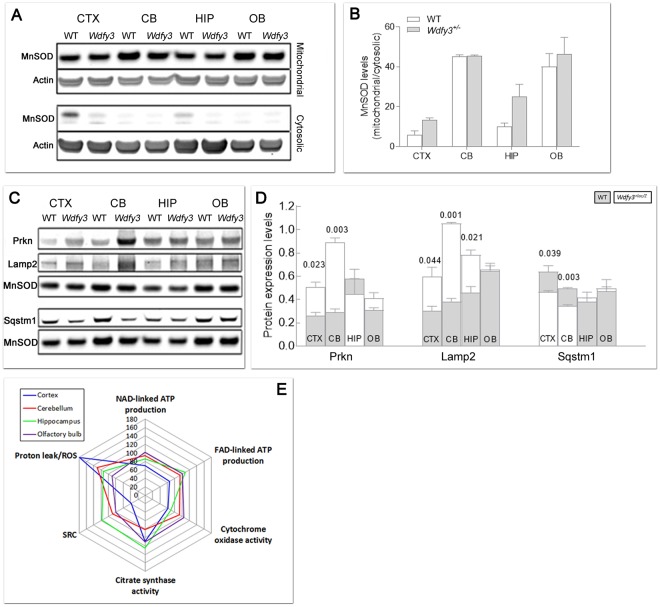
Figure 8.
Expression of autophagy and mitophagy-related proteins and bioenergetics outcomes in brain regions from Wdfy3-haploinsufficient mice. (A,B) Degree of mitochondrial enrichment per each brain area. Shown are representative Western blots (A) and densitometry (B) of MnSOD and actin as markers of, respectively, mitochondrial and cytosolic compartments, for evaluation of mitochondria purity in each brain region. Statistical analysis was performed with the Mann-Whitney test between WT and Wdfy3 mice for each brain area. (C,D) Representative Western blots (C) and densitometry (D) of mitophagy-related proteins (Parkin, Lamp2, Sqstm1) in mitochondrial-enriched fractions obtained from cortex (CTX), cerebellum (CB), hippocampus (HIP), and olfactory bulb (OB) of WT (gray bars) and Wdfy3-haploinsufficient mice (white bars). Full-length Western blot images are shown in Supplementary Fig. S4. Data are shown as mean ± SEM of samples ran in duplicates (n = 3 WT and 5 Wdfy3+/lacZ). Statistical analysis was performed with the Mann-Whitney test between WT and Wdfy3 mice for each brain area. MnSOD was used as mitochondrial loading control. The protein expression of other mitophagic proteins (Pink1, Mfn2, Vdac and LC3I and LC3II) is shown in Supplementary Fig. S2. (E) ATP-driven oxygen uptake rates were evaluated in mitochondria-enriched fractions from the indicated brain regions from mice of each genotype. Substrates utilized for driving the oxygen uptake in phosphorylating mitochondria in the presence of ADP were malate-glutamate (NAD-linked ATP production) and succinate (FAD-linked ATP production). Complex IV or cytochrome c oxidase activity (CCO) is reported as a marker of mitochondrial inner membrane whereas citrate synthase activity (CS) as a marker of mitochondrial matrix. All values were expressed as percentages of control. All p-values calculated using the 1-tailed t-test. Values were taken from Supplementary Tables S1–S4. The number of mice utilized were n = 11 and 16 respectively for WT and Wdfy3+/lacZ cortex and cerebellum, n = 3 and 5 respectively for WT and Wdfy3+/lacZ hippocampus and olfactory bulb (Supplementary Tables S1–S4). A spider chart was used to plot the various mitochondrial outcomes to facilitate their visualization and comparison across brain regions. The spider plot consisted of a sequence of 5 equi-angular spokes or radii representing each of the mitochondrial outcomes evaluated. The data length of a spoke is proportional to the magnitude of the outcome relative to the maximum magnitude of all variables across all data points (i.e., 180). For each brain region, a line was drawn connecting the data values for each spoke, resulting in a star-like appearance.

