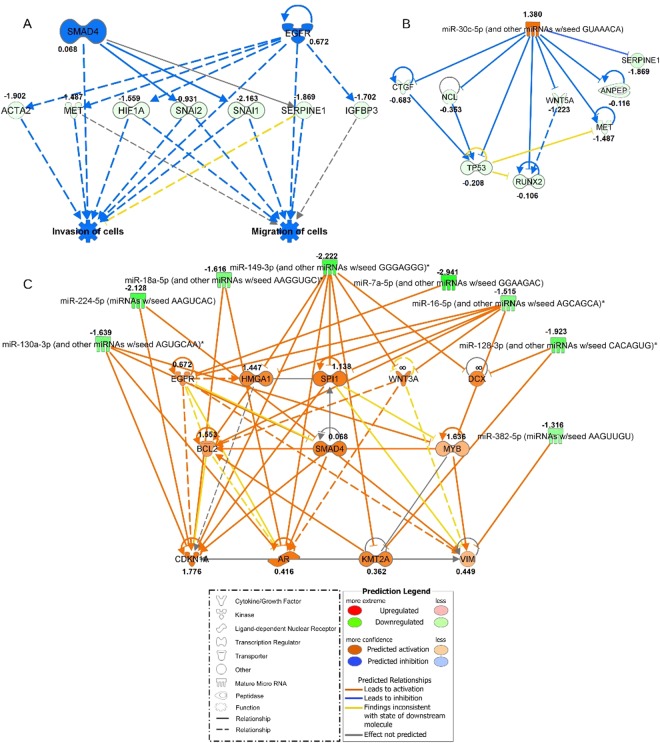
Figure 5.
Networks generated in Ingenuity Pathway Analysis (IPA) for ASCs cultured in standard FBS-supplemented and FBS-deprived conditions for five biological replicates (plastic surgery patients, Supplementary Table S1). The values next to the gene names refer to log2 fold change of gene expression calculated in the cufflinks package. The shapes and colors of molecules and type of interactions are defined in the graphical legends. (A) Top Regulator Effects network based on differentially expressed genes in both experimental conditions with highest consistency score of 3.024. The middle row consists of molecules that are connected to upstream regulators in the top row and downstream functions in the bottom row. (B) miRNA-mRNA negative correlation network with upregulated mir-30 family and anti-correlated mRNA targets generated in microRNA Target Filter Tool in IPA. (C) miRNA-mRNA negative correlation network with downregulated 8 miRNAs and their upregulated direct targets. miRNAs indicated with a star refer to miRNA families that share common seed sequence with those significantly changed in our dataset.

