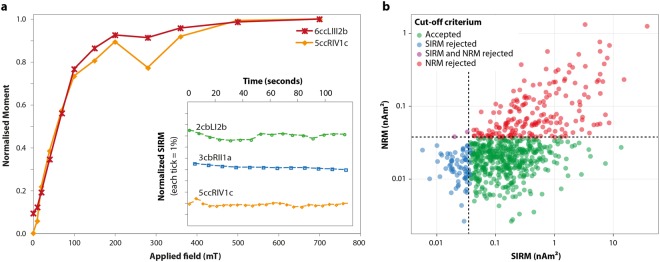
Figure 1.
(a) Acquisition of saturation isothermal remanent magnetization (SIRM) for two cerebral cortex (cc) specimens. The insert shows the change in magnetization as a function of time for two cerebellum (cb) specimens and one cerebral cortex specimen after being exposed to a 0.8 T field. Sample identification begins with brain number, cc or cb, hemisphere (L or R), horizontal level (I–IV), sagittal section (1–2) and row (a–c). (b) Log-log plot of natural remanent magnetization (NRM) versus SIRM for all measured samples (non-mass normalized). Dashed lines indicate levels of 3.75 × 10⁻¹¹ Am2. The cut-off method accepted the data points in green; red and blue points were rejected based on the NRM or SIRM cut-off criteria as described in the text.

