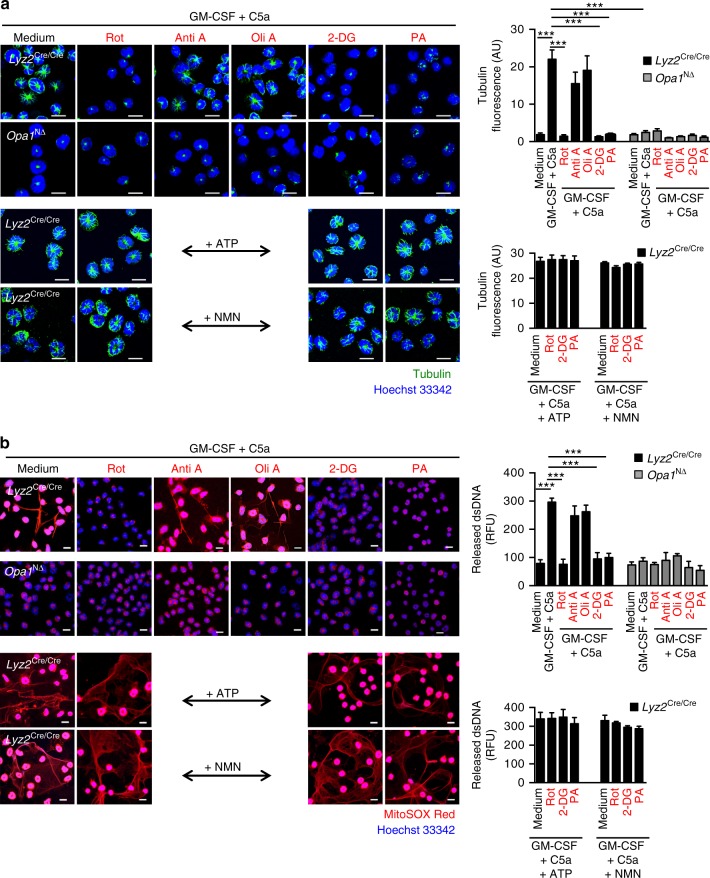
Fig. 6.
Pharmacological inhibition of mitochondrial complex I activity and glycolysis blocks microtubule network formation and extracellular DNA release. a Confocal microscopy. Opa1N∆ and control neutrophils were pretreated with 10 µM rotenone (Rot), 5 µg per ml antimycin A (Anti A), 2.5 µg per ml oligomycin A (Oli A), 3 mM 2-DG, or 0.5 µM piericidin A (PA) for 30 min before GM-CSF priming and subsequent C5a activation. Lower panels: control mouse neutrophils were pretreated with 100 µM ATP or 500 µM NMN, incubated in presence or absence of the indicated inhibitors, and subsequently stimulated with GM-CSF/C5a. Microtubules were stained with anti-α-tubulin antibody (green). Bars, 10 µm. Right: Quantification of microtubule network formation was performed by automated analysis of microscopy images using Imaris software. Values are means ± SEM. ***p < 0.001; n = 3. b Confocal microscopy. Neutrophils of Opa1N∆ and control mice were pretreated with 10 µM Rot, 5 µg per ml Anti A, 2.5 µg per ml Oli A, 3 mM 2-DG, or 0.5 µM PA for 30 min before GM-CSF priming and subsequent C5a activation. Lower panels: control mouse neutrophils were pretreated with 100 µM ATP or 500 µM NMN, incubated in presence or absence of the indicated inhibitors, and subsequently stimulated with GM-CSF/C5a. Extracellular DNA was stained with MitoSOX™ Red and the nucleus with Hoechst 33342 (blue). Bars, 10 µm. Right: quantification of released dsDNA in supernatants of activated neutrophils. Values are means ± SEM. ***p < 0.001; n = 3. Additional data using human neutrophils are provided in Supplementary Figs. 7 and 10

