Fig. 7.
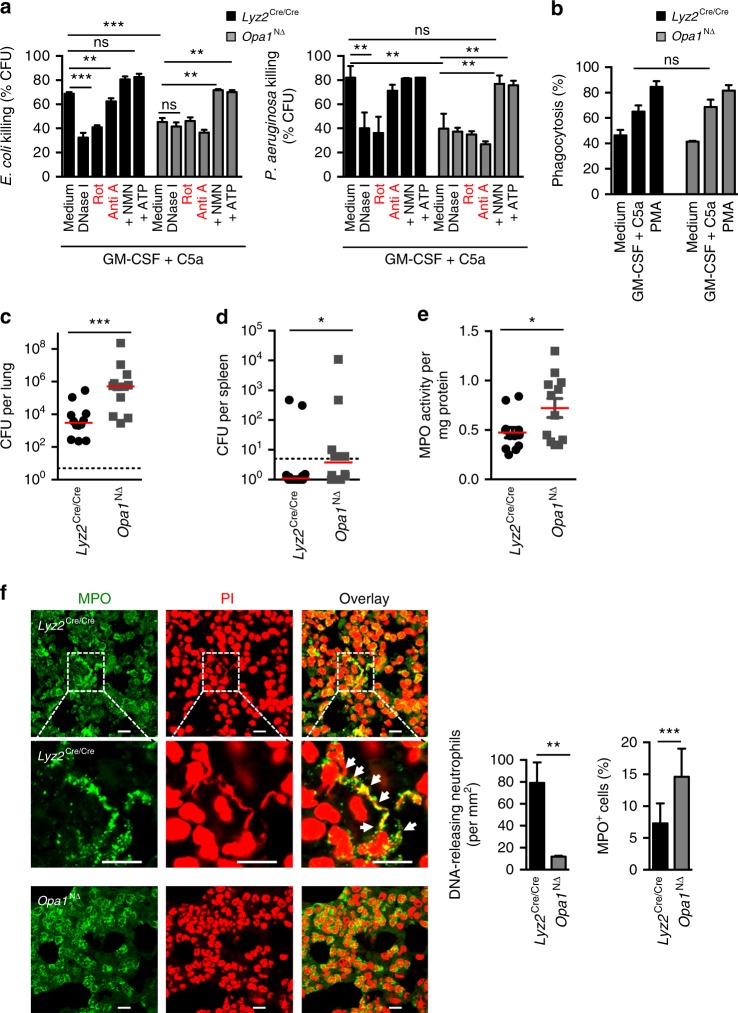
Anti-microbial response of Opa1N∆ neutrophils and failure to clear P. aeruginosa lung infections. a Bacterial killing assays. Neutrophils of Opa1N∆ and control mice were primed with GM-CSF and subsequently stimulated with C5a before co-culture with E. coli–GFP (left panel) and P. aeruginosa (right panel) in presence or absence of the indicated inhibitors or following 100 μM ATP or 500 μM NMN pre-treatment. Values are means ± SEM. n.s., not significant; **p < 0.01; ***p < 0.001; n = 4. b Phagocytosis assay. Phagocytosis of opsonized E. coli-GFP by Opa1N∆ and control neutrophils was analyzed after 35 min. Values are means ± SEM (n = 3); n.s., not significant. c, d Bacterial clearance in vivo. Opa1N∆ and control mice were intra-nasally inoculated with 2 × 10⁶ CFUs of P. aeruginosa. Total CFU numbers of bacteria were assessed by plating homogenized lungs (c) and spleen (d) on agar plates. The medians are indicated and each symbol represents a value for an individual mouse. *p < 0.05; ***p < 0.001. e MPO enzymatic activity assay. Neutrophil infiltration of lungs in Opa1N∆ and control mice was assessed by MPO activity in total lung homogenates. The medians are indicated and each symbol represents a value for an individual mouse. *p < 0.05. f Confocal microscopy. Lung sections of Opa1N∆ and control mice were obtained after infection with P. aeruginosa and stained with anti-MPO antibody (green) and PI (red). Higher magnifications are shown in the middle panels; white arrows indicate co-localization of extracellular DNA and MPO. Bars, 10 µm. Right: quantification of the DNA-releasing and infiltrating neutrophils in the lungs. Quantification of MPO positive infiltrating neutrophils compared with total PI positive nuclei in the infected lungs using an automated slide scanner. Values are means ± SEM. **p < 0.01; ***p < 0.001; n = 3

