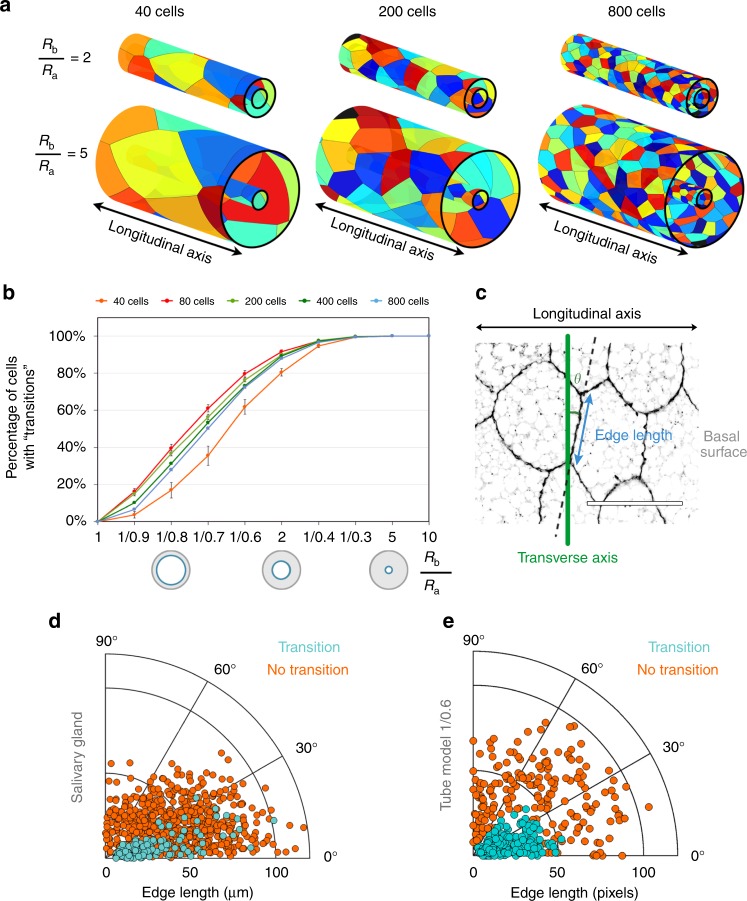
Fig. 3.
Apico-basal transitions are favoured by geometrical factors. a Examples of the 40, 200, and 800 cells models resulting from basal expansions of two and five times the apical surface. Data are represented as mean ± SEM. b Percentage of cells involved in transitions (scutoids) in relation to the increase of the surface ratio for five conditions (40, 80, 200, 400, and 800 cells). c Scheme showing how are measured the edge angle with respect the transverse axis (θ) and the edge length in a four-cells motif of the basal surface of the salivary gland. Scale bar = 100 μm. d Polar scatter showing the length and the angle of the contacting edge in basal four-cell motifs from the salivary gland epithelium. Light blue points stand for motifs that exchange neighbours; orange points stand for motifs that do not intercalate. e Polar scatter showing the length and the angle of the contacting edge in basal four-cell motifs from the tubular model with the 1/0.6 surface ratio. Light blue points stand for 200 motifs that exchange neighbours; orange points stand for 200 motifs that do not intercalate

