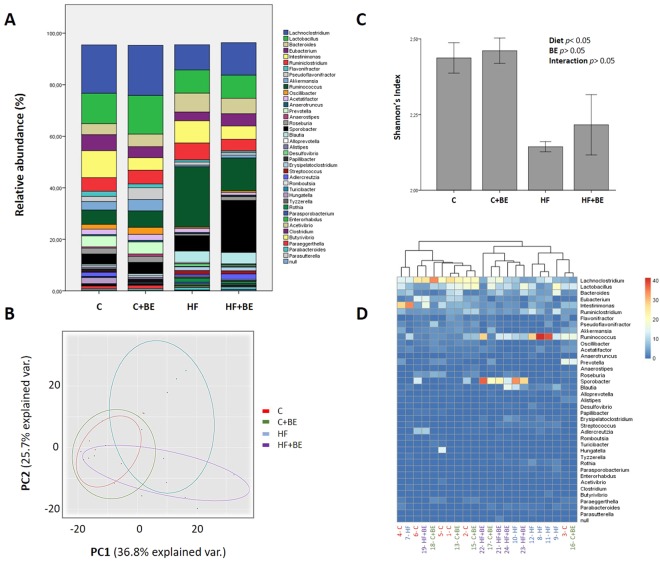
Figure 2.
Gut microbiota composition at the genus level among groups (n = 5–6 per group). (A) Relative abundance of gut bacterial genera. Bars represent the average of each genus relative abundance in the 4 different diet groups. Each genus is represented by a different color. (B) Shannon’s diversity index among groups. Values are expressed as mean ± SEM. (C) Gut bacterial genera were clustered using principal component analysis (PCoA). Results are plotted according to the first two principle components, which explain 36.8% (PC1) and 25.7% (PC2) of the variation in gut microbial composition (at genus level) between samples. Each point represents one sample and each diet group is denoted by a different color. Circles combine samples from the same diet group by their respective 95% confidence interval ellipse. (D) Heatmap and hierarchical clustering of the relative abundance of gut bacterial genera. Rows correspond to operational taxonomic units (OTUs) and columns represent the animals of the 4 different diet groups.

