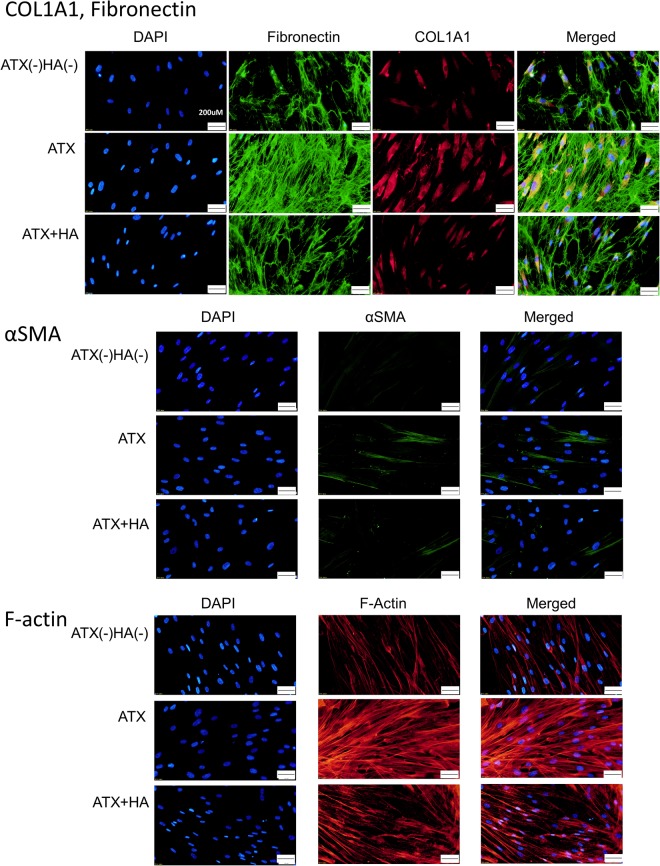
Figure 6.
Immunocytochemistry of fibronectin, COL1A1, F-actin and αSMA in HCFs. The left panels show cells that were stained with DAPI. The middle panels show cells stained for either COL1A1, fibronectin, F-actin orαSMA. The right panels show merged image. The expression of COL1A1 and fibronectin is shown in the upper row, αSMA in the middle row, and phalloidin in the lower row. These components were upregulated in HCFs with ATX treatment, and the fibrotic responses were significantly suppressed by HA130 treatment. Bar, 200 μm.

