Fig. 9.
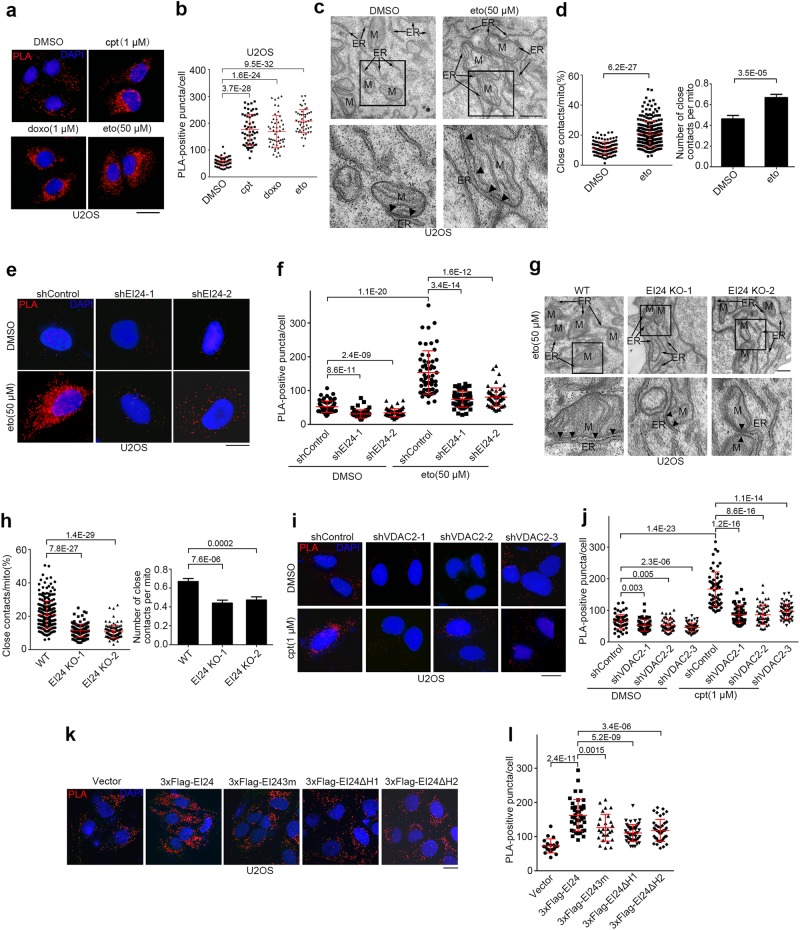
DNA Damage Promotes ER-mitochondria Contacts through EI24 and VDAC2. a U2OS cells stably expressing CFP-ER were treated with cpt, doxo or eto for 12 h, and subjected to PLA. Scale bar, 10 μm. b Quantification of the number of PLA-positive puncta/cell in a. c Representative EM images of U2OS cells treated with eto for 12 h. The boxed areas at the top are magnified at the bottom. The arrowheads indicate the ER-mitochondria contacts. ER endoplasmic reticulum; M mitochondrion. Scale bar, 500 nm. d Quantification of the ratio (%) of ER-mitochondria contacts (<30 nm) to the mitochondrial surface area and the average number of close contacts per mitochondrion in c. e U2OS cells stably expressing CFP-ER were transfected with either control (shControl) or EI24 shRNA (shEI24), treated with DMSO or eto for 12 h, probed with anti-TOM20 and anti-GFP antibodies, and subjected to PLA. Scale bar, 10 μm. f Quantification of the number of PLA-positive puncta/cell in e. g Representative EM images of wild-type (WT) and EI24-knockout (KO) U2OS cells treated with eto for 12 h. The boxed areas at the top are magnified at the bottom. Arrowheads indicate the ER-mitochondria contacts. ER, endoplasmic reticulum; M, mitochondrion. Scale bar, 500 nm. h Quantification of the ratio (%) of ER-mitochondria contacts (<30 nm) to the mitochondrial surface area and the average number of close contacts per mitochondrion in g. i Representative images of PLA results of U2OS cells stably expressing CFP-ER and transfected with either control or VDAC2 shRNA (shVDAC2), treated with DMSO or cpt for 12 h. Scale bar, 10 μm. j Quantification of the number of PLA-positive puncta/cell in i. k U2OS cells that stably expressed CFP-ER and overexpressed the vector, 3× Flag-EI24, 3× Flag-EI243m, 3× Flag-EI24ΔH1 or 3× Flag-EI24ΔH2 were subjected to PLA. Scale bar, 10 μm. l Quantification of the number of PLA-positive puncta/cell in k

