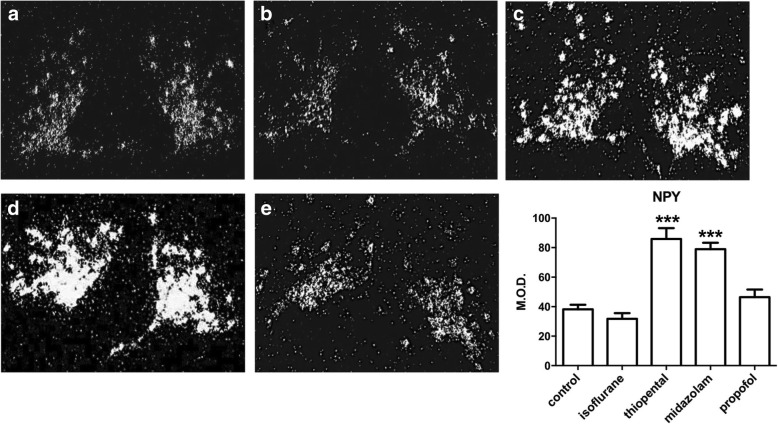
Fig. 2.
NPY mRNA level expression evaluated by quantification of In Situ Hybridization after hypnotics administration. X10 magnification darkfield microphotographies illustrate the expression of NPY mRNA in hypothalamus. a control, (b) isoflurane, (c) thiopental, (d) midazolam, (e) propofol. Results are also presented as means with confidence interval of 95% (n = 8 mice per group). *** P < 0.001 NaCl control versus other groups. NPY: Neuropeptide Y, M.O.D.: Mean Optical Density. Comparisons has been made using an Analysis of Variance

