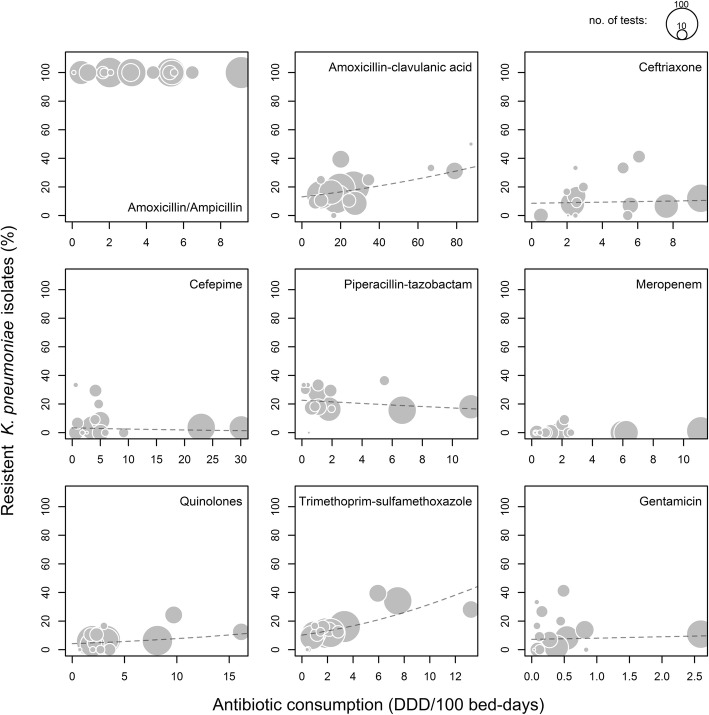
Fig. 3.
Comparison of the proportions of resistant nosocomial K. pneumoniae and antibiotic use. Each point indicates the time-averaged values for an individual department for the period between 2008 and 2016. The size corresponds to the number of bacteria tested for resistance, i.e. reflects the precision of the resistance estimate. The dashed lines indicate the fitted value from the logistic mixed models

