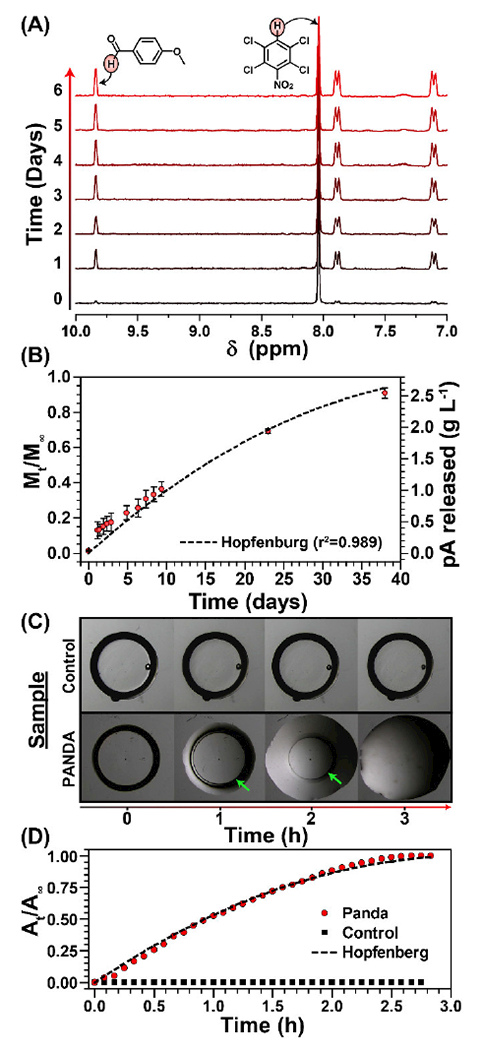
Figure 2.

Degradation of PANDAs. (A) 1H NMR degradation kinetics of PANDA at pH 7.4. (B) Cumulative release of pA from PANDA subjected to pH 7.4. (C) Kinetic optical microscopy images of a PANDA disk submerged in 1 N HCl. Green arrows indicate remaining PANDA disk. (D) Calculated cumulative area from 1N HCl degradation kinetics determined by imageJ analysis.
