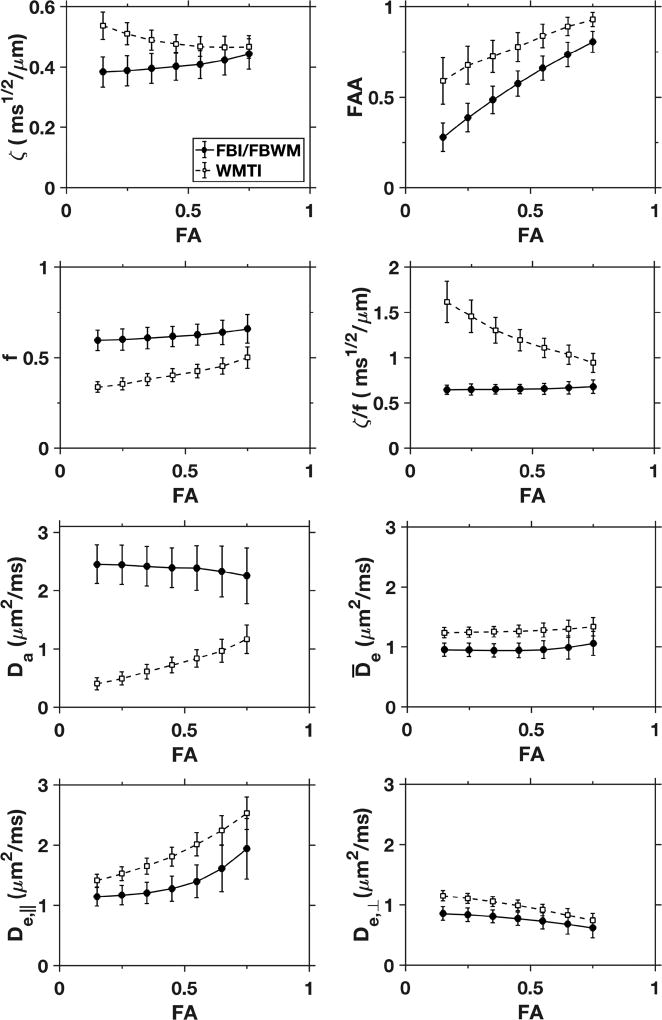
Figure 5.
Selected diffusion measures versus FA. All white matter voxels for all three subjects and both imaging runs were pooled. The solid data points are averages calculated with either FBI (ζ, FAA) or FBWM (f, ζ / f, Da, , De,‖, De,⊥), while the open data points are all averages calculated with WMTI. The error bars indicate standard deviations. For the FBI/FBWM parameters, Da, , and ζ / f vary little with FA, but an FA dependence is discernible for the other metrics. The WMTI averages are relatively close to the FBI/FBWM values for ζ, , and De,⊥, at least for FA > 0.5 where the assumptions underlying WMTI are better justified. Otherwise substantial differences are apparent. In particular, the WMTI estimates for Da are much smaller than the FBWM estimates over the full range of FA.

