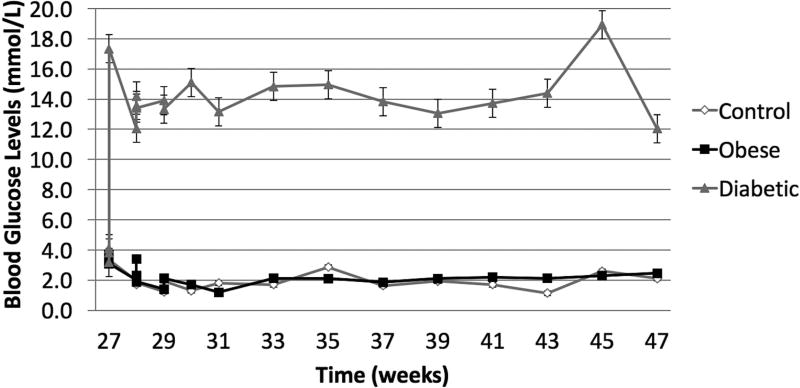
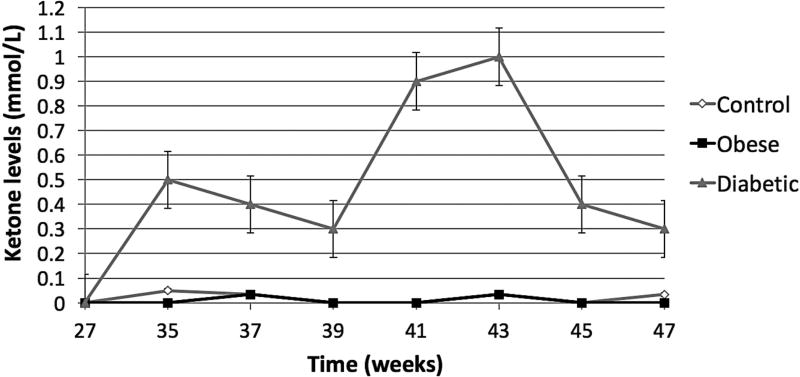
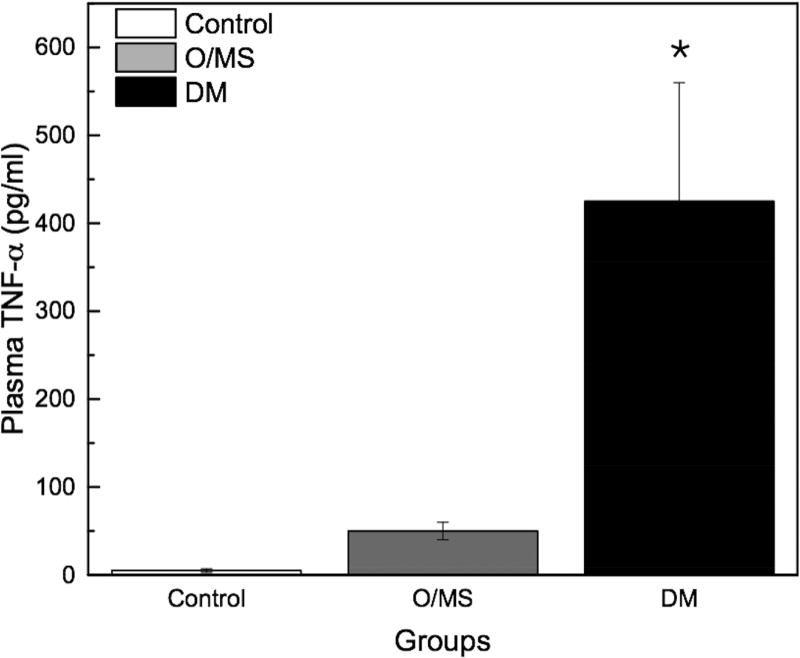
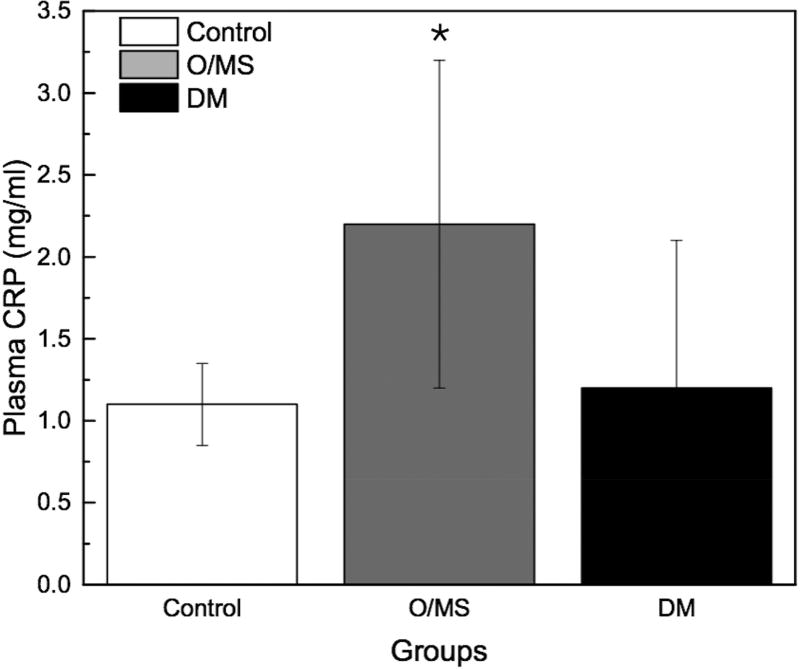
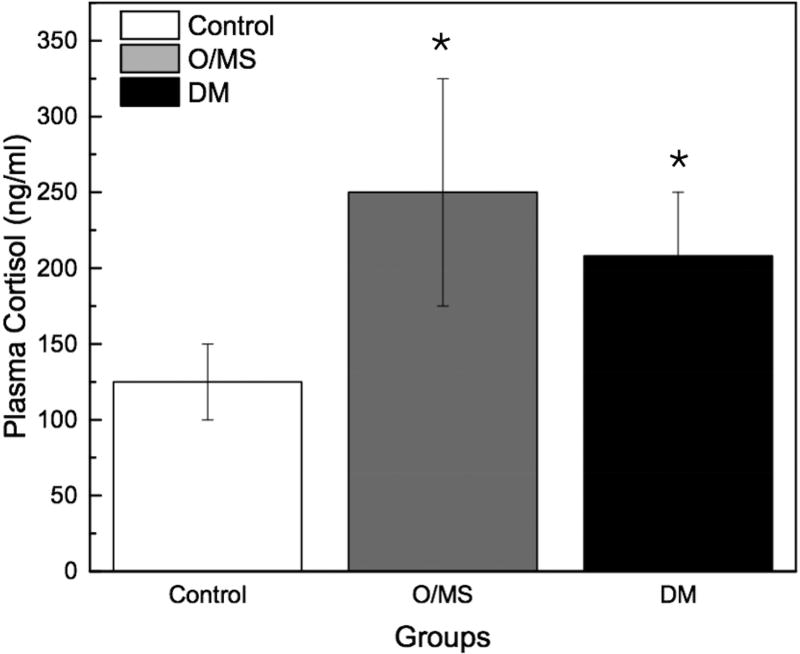
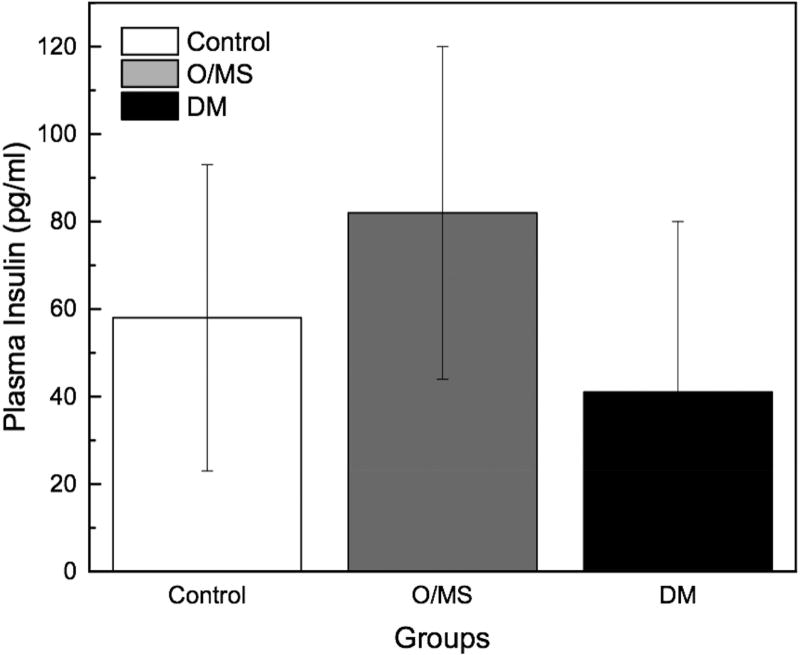
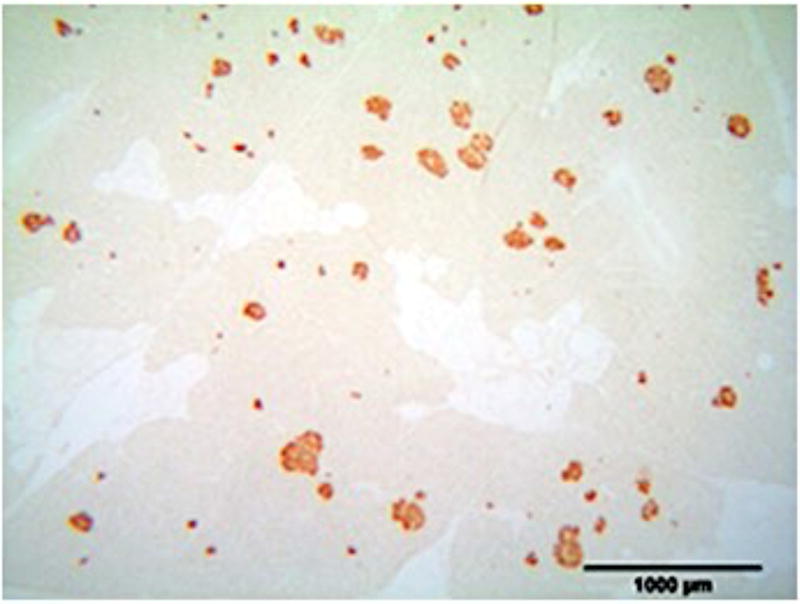
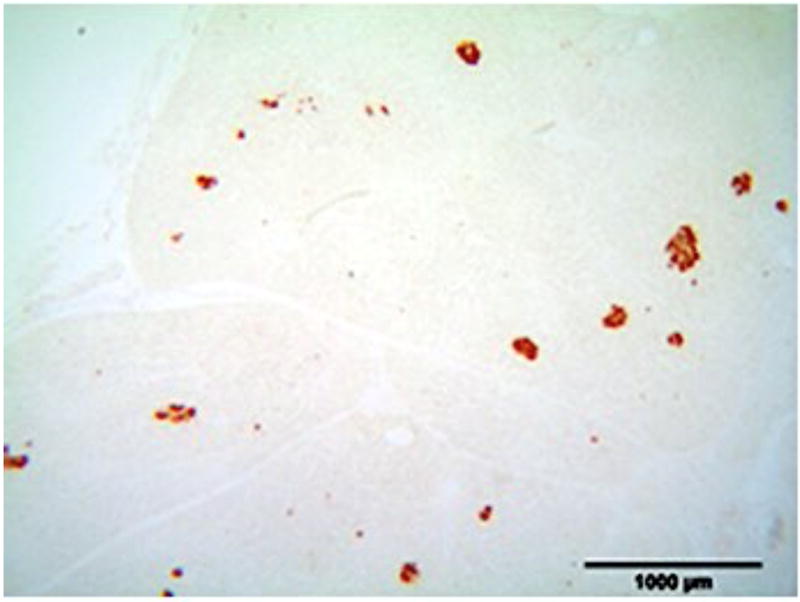
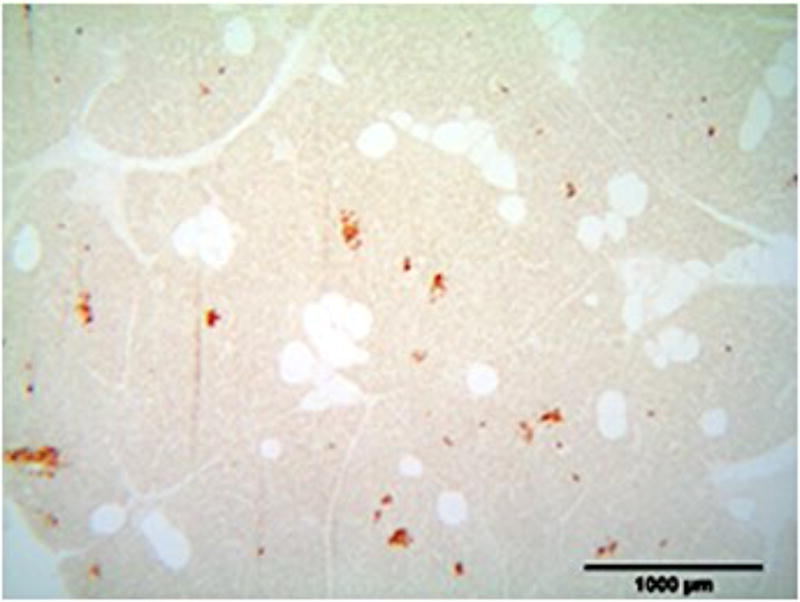
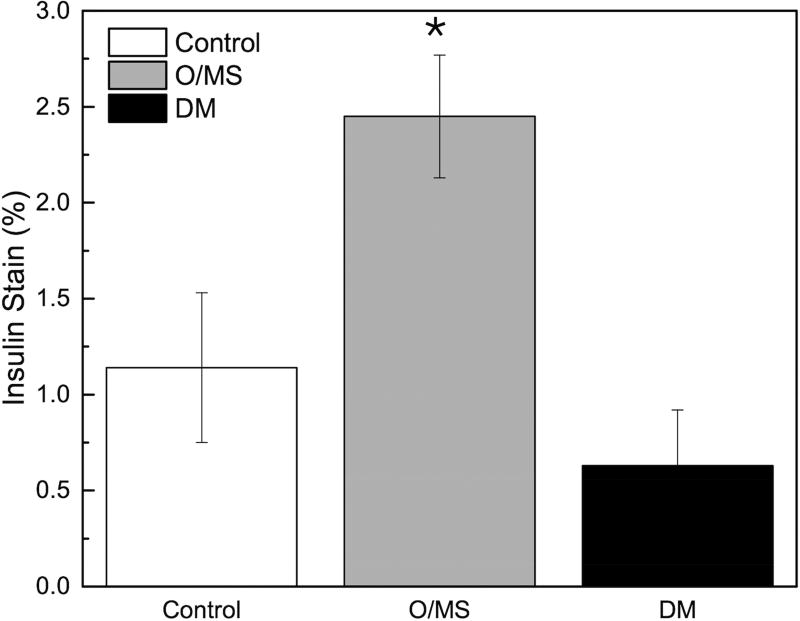
Figure 2. Blood marker profiles demonstrate effective induction of metabolic syndrome and a DM phenotype.
A) Blood glucose levels following STZ administration. Glucose levels are particularly elevated in DM animals while O/MS animal levels are comparable to control. B) Blood ketone levels are elevated in the DM group. Obese and control groups remain at basal levels. C–F) Average plasma levels of Tumor necrosis factor-α (TNF-α), Creactive protein (CRP), Cortisol and Insulin taken at the time of implantation and termination. Overall pro-inflammatory status is evident in the O/MS and DM groups. G–J) Immunohistochemical staining and quantification of insulin on pancreatic tissue sections demonstrate significantly increased staining in (H) O/MS pigs compared to (G) controls and (I) DM, however no (J) statistical differences was detected between controls and DM. The number of asterisks denotes statistically homogeneous groups.

