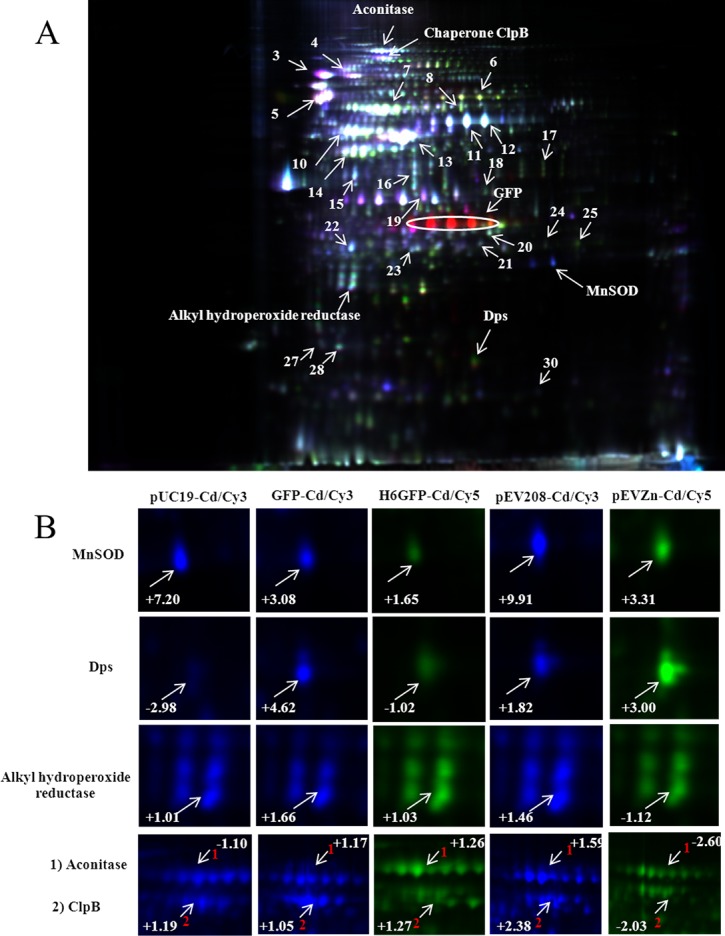
Figure 7. Quantitative proteomics analysis of proteins via 2D-DIGE.

Two different samples were individually labeled with two kinds of fluorescent dyes (Cy3 and Cy5) and co-separated in one gel (A). An internal standard, derived from a mixture of all samples pooled together and labeled with Cy2, was created to facilitate the normalization of each spot among all gels. Protein spots with changes in abundance ratio of 1.5 fold and P values < 0.05 (Student’s t-test) were identified and compared between the gels (B).
