
Figure 2.
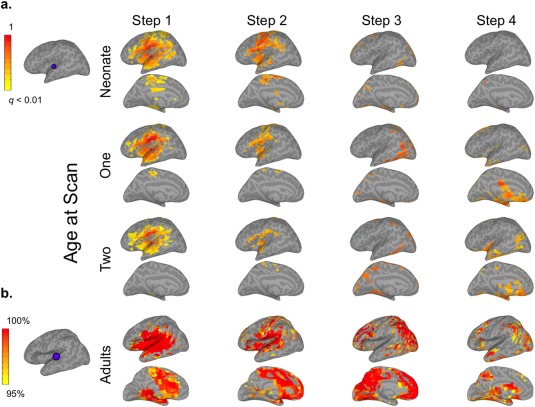
mSFC of the auditory (AUD) seed in infants and adults (see Supporting Information Fig. S2 for right hemisphere). (a) The AUD seed in infant template space is shown on the top left. Infant results (right) are thresholded at P < 0.01 (FDR corrected) and scaled to the maximum t‐value. (b) The adult AUD seed is displayed to the left of adult maps, which are scaled to show mSFC that was significant (P < 0.01, FDR corrected) at the group level and for at least 95% of 1000 iterations, including 28 randomly‐selected adults for each iteration. [Color figure can be viewed at http://wileyonlinelibrary.com]