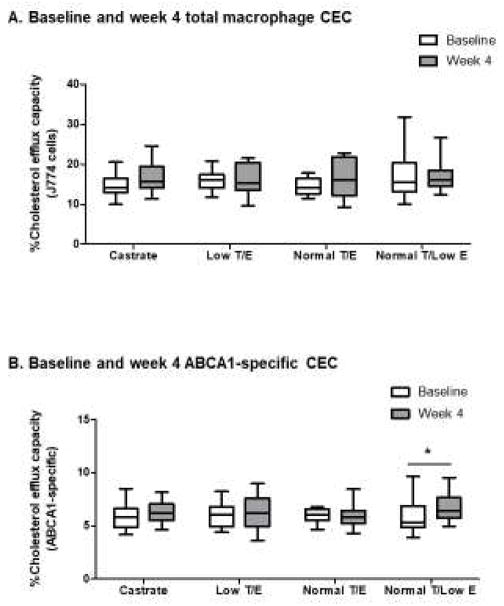
Figure 3.
Changes in CEC across treatment groups during the 4-week treatment period. Neither differences across groups nor within-group changes were seen for total macrophage CEC (A). A significant increase in ABCA1 CEC was evident over the 4-week treatment period among subjects who underwent selective estrogen deprivation (B). Whiskers = minimum to maximum values, *p<0.05 for within-group change

